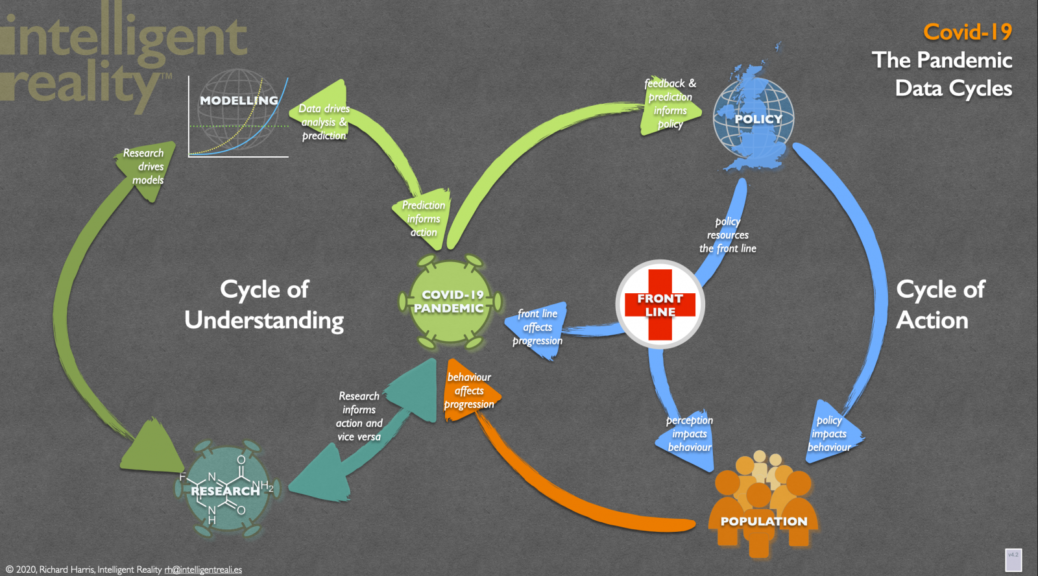
We all want a normal life. And politicians feel the pressure from their parties and constituents to restore normality as rapidly as possible. Unfortunately, there’s a dissonance between their reluctance to then take needful and decisive action at the earliest possible opportunity and the long-term consequences from the pandemic, where a tendency to treat the pandemic as transactional – something you can bargain with – has driven a patchwork, limited and often counterproductive response to the pandemic. Continue reading The (Long and Winding) Road to Normal
Tag Archives: covid-19
Proving a Point?
There’s been a lot of covoptimism this past week, from assorted government spokesfolks, including from people who do know what they’re talking about – a prime example being Prof. Neil Ferguson of Imperial. The theme here is that cases, case rates and the R number have been falling strongly and appear to be continuing to do so.
That’s true, to a point. But our modelling suggests that the immediate future is less rosy.
It’s not about the data – we use the same published sources as the government, albeit that they’ve got access to more sources than we do – it’s more about what you do with it.
Building a Better Crystal Ball
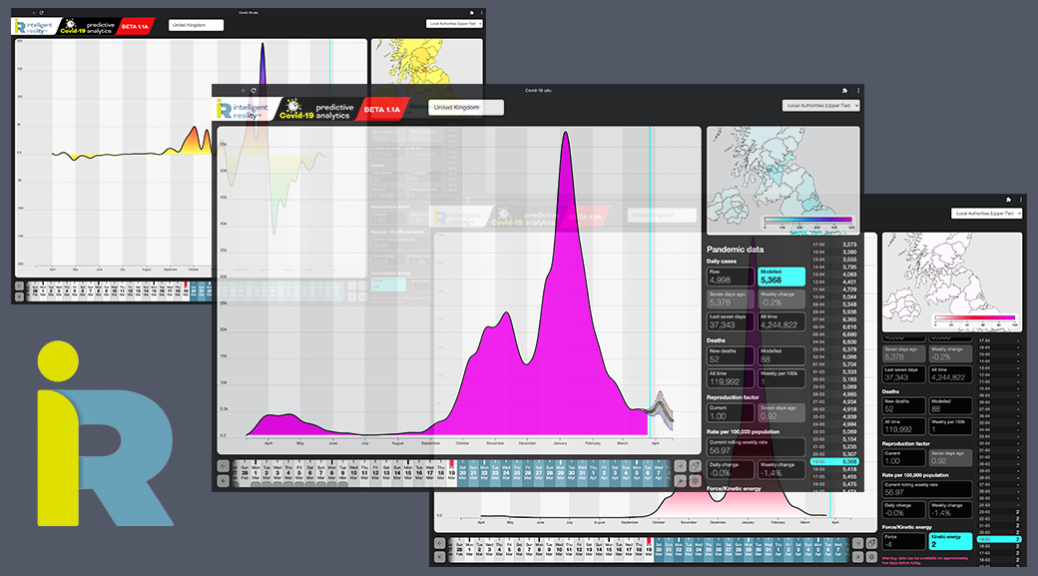
Another Friday update: we’re well into our private Beta of our predictive analytics and what-if? modelling system for Covid-19 analytics.
So what is it telling us today?
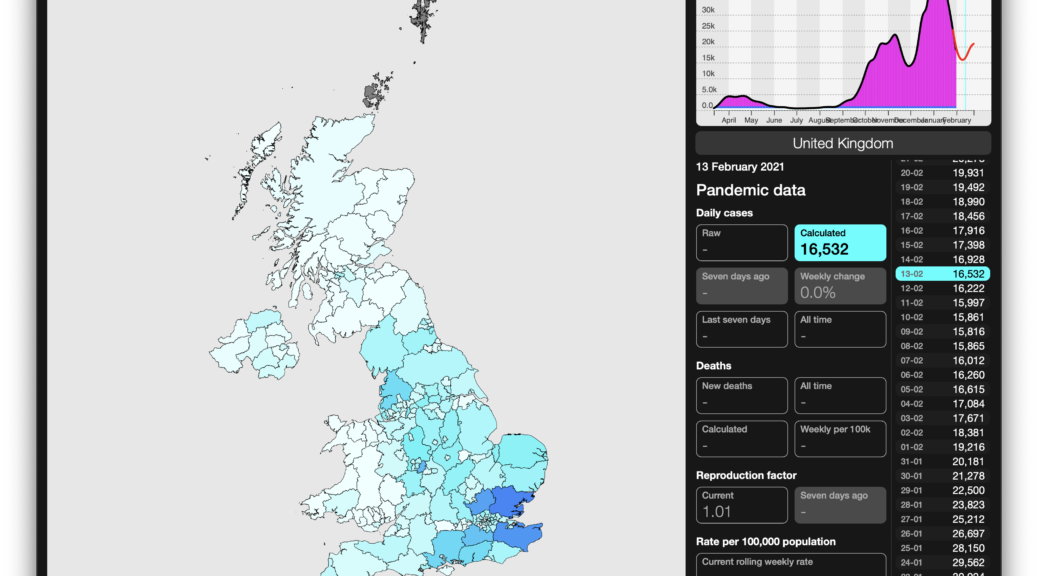
As of 3rd February our projections are (within their confidence limits, which of course become broader the further out we look, even if the central projection is tracking the reality curve well), that the R number bottoms out about now for the UK as a whole, with case numbers continuing to fall until around the 9th, by which time R number is back to .92 and, by the 13th, it’s more likely to be above 1 again, mostly driven by the SE (Essex particularly) and Merseyside (see header picture).
Lagging Decisions, Big Consequences?
On Friday 29th January, the Scottish Government announced that Na h-Eileanan Siar (the Western Isles) is being put into Level 4 lockdown, following a surge of new cases.
On the basis of the data available to us and our modelling approach, we’re not convinced about this decision: it appears to have be made on the basis of out-of-date analysis in an area which turned the corner on this outbreak some time ago.
Our emergent analytics, which generate fresh outlooks every day, suggest that the peak of the outbreak here was passed on 19th January and that it has declined, on multiple metrics, since then.
Kinetics of a Pandemic
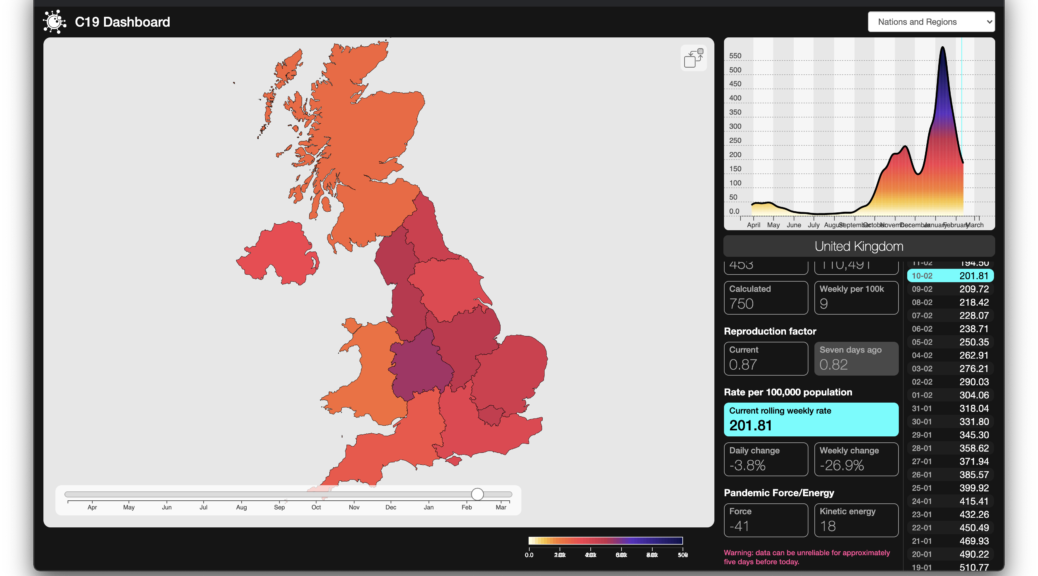
We’ve been thinking for some time about how best to present the dynamic of the pandemic in a way that actually shows what’s happening – the R number doesn’t give any idea of magnitude and is – in our opinion – best kept behind the scenes as a contributor to analytic models, raw or compensated case numbers are just that – daily records – shocking enough in themselves but they still don’t show the energy in the thing. Continue reading Kinetics of a Pandemic
Animating the UK
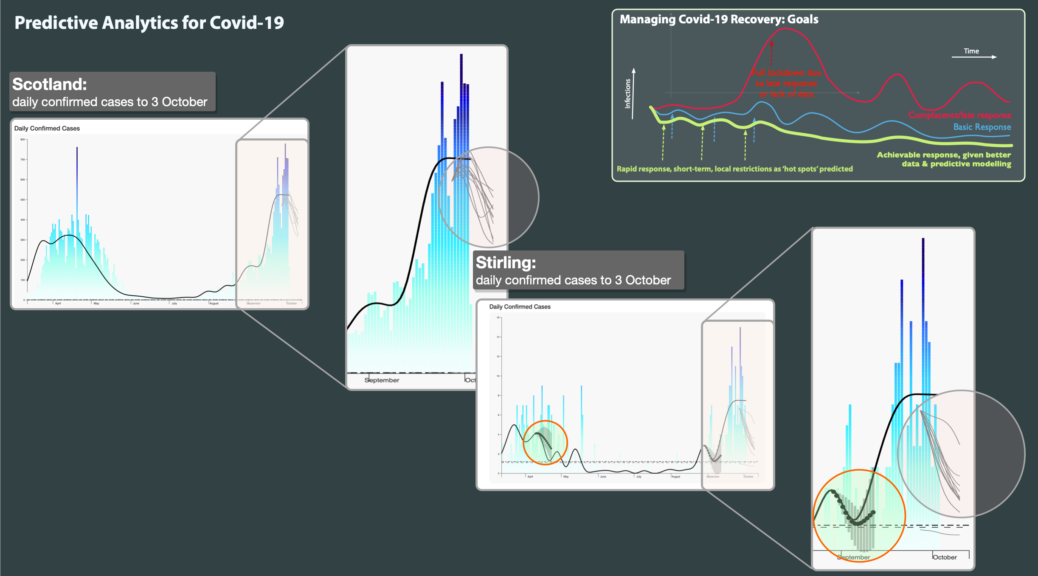
Over the last few months, we have been using advanced data intelligence to improve the sourcing, timeliness and validation of Covid-19 statistics. We then use our emergent and adaptive platform to provide high quality predictive modelling of its likely progress.
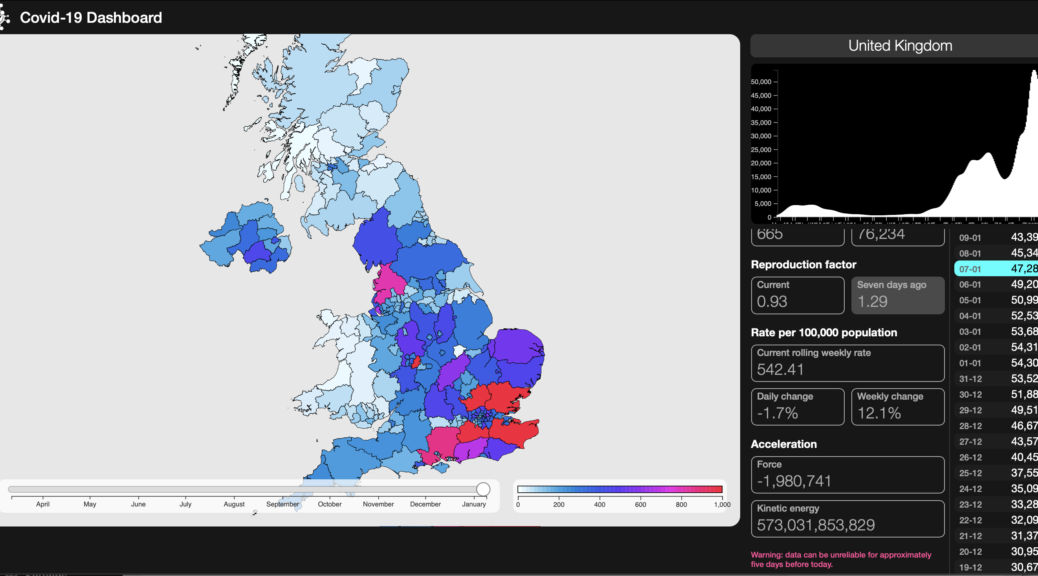
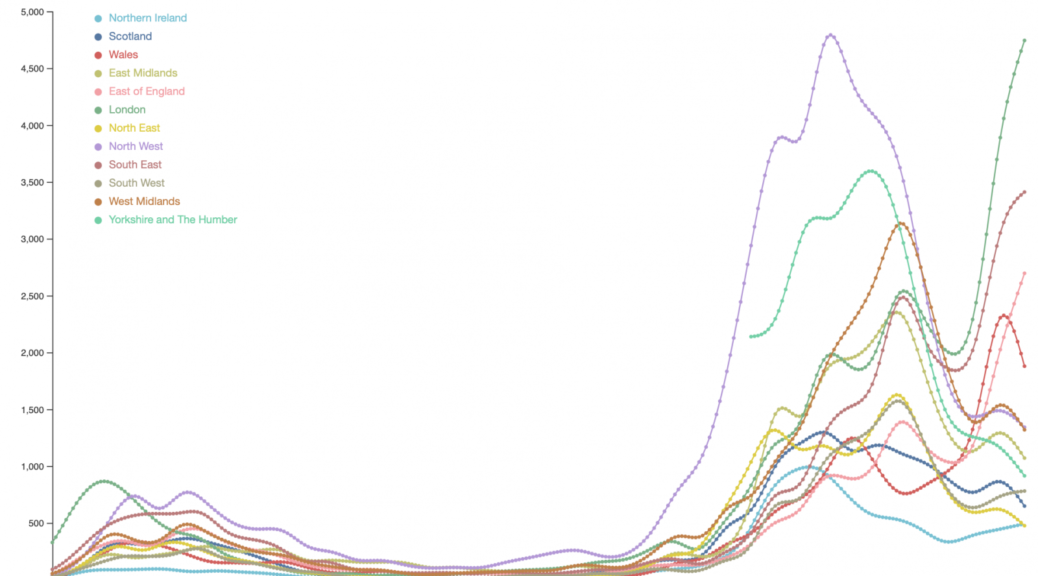
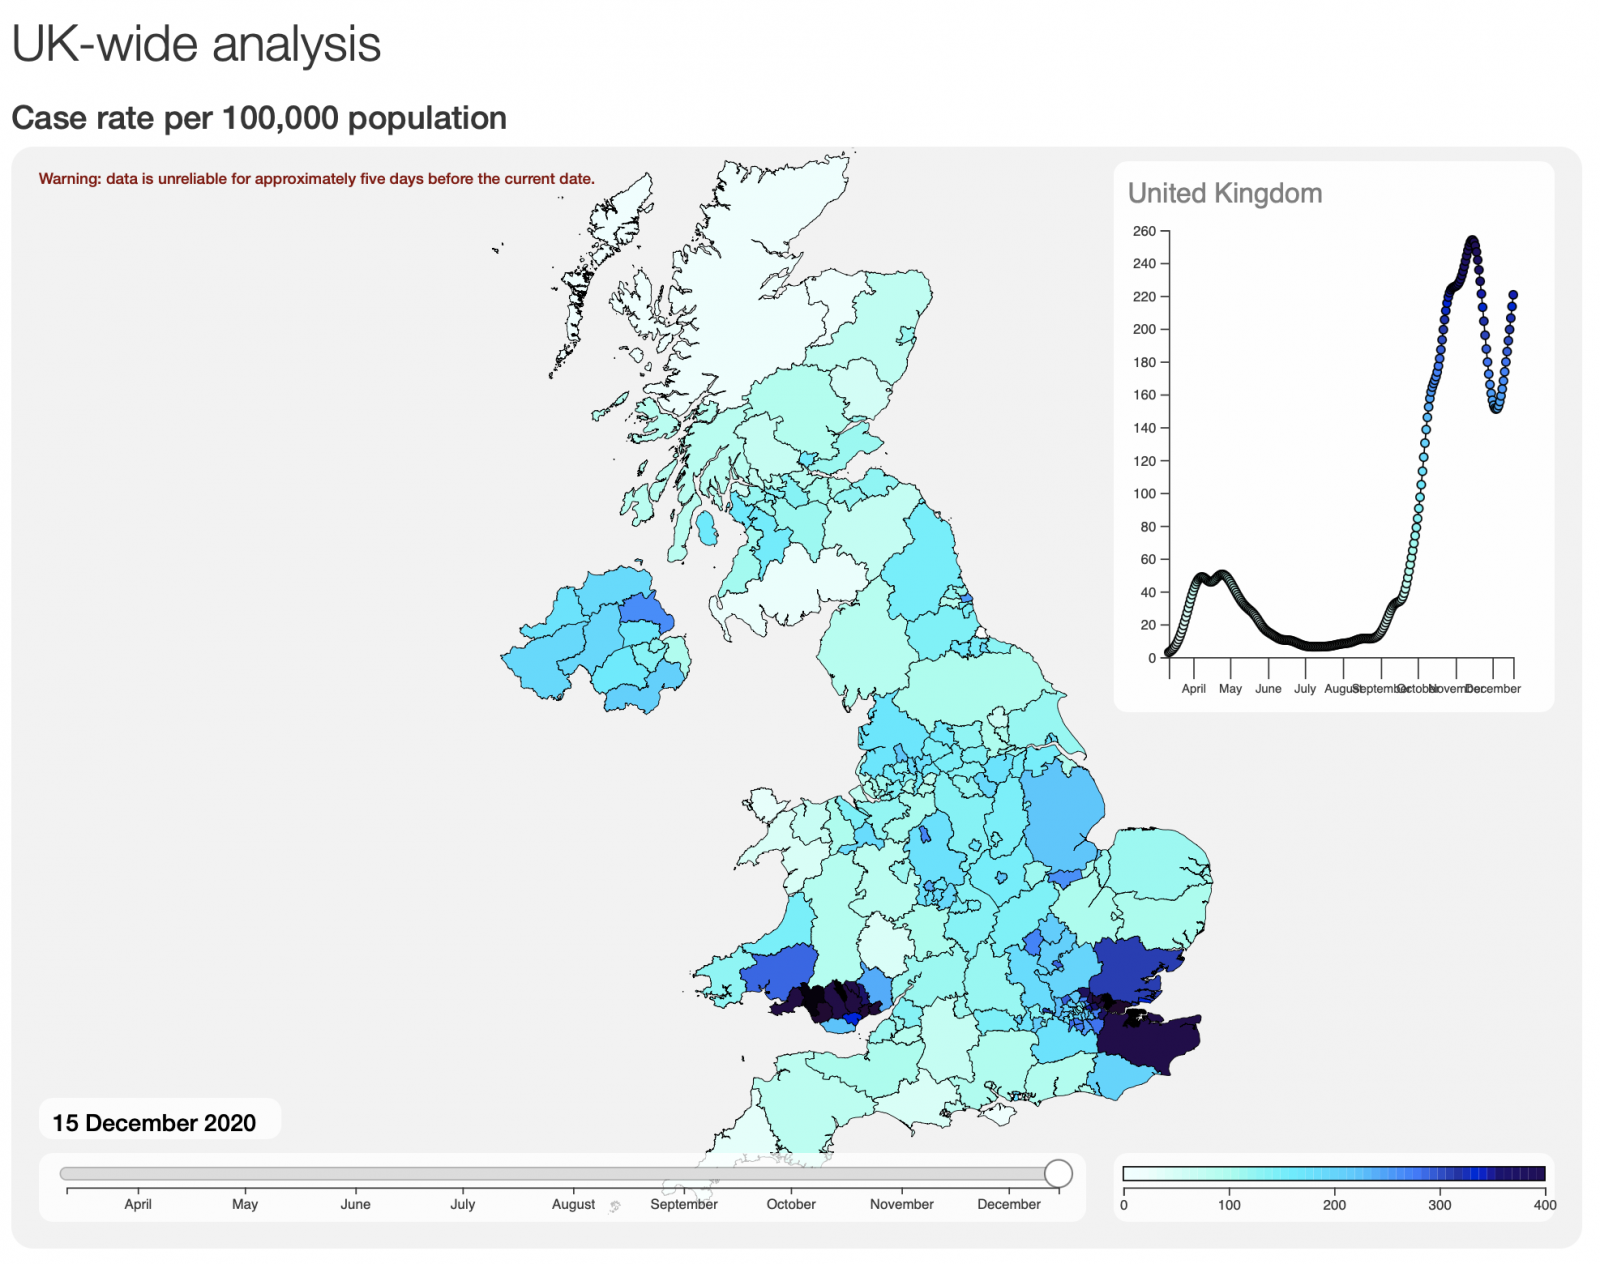
Human nature being what it is, people have become somewhat desensitised to raw numbers and to the differences between the first surge of the virus in March-May and where we are now, despite that difference being genuinely scary, as any front line medic will confirm, if they still have the energy. So anything that helps communicate the current situation more effectively can only help – this is one of our alpha stage experiments, animating the rolling case rate per 100,000 population for the UK, from March 12 2020 to January 5 2021.
Here We Go. Again.
Throughout the pandemic, we’ve watched UK government Covid-19 policy-making as it appears to follow a drunkard’s walk between, on the one hand, an inherent laziness of response and a politically-influenced disinclination to act and, on the other, an attempt to claim some sort of causal relationship with the scientific and real world advice that they’re being given. The core mantra apparently is to do nothing until it’s too late, then blame any combination of scientists, the wider population and random acts of nature for the outcome.
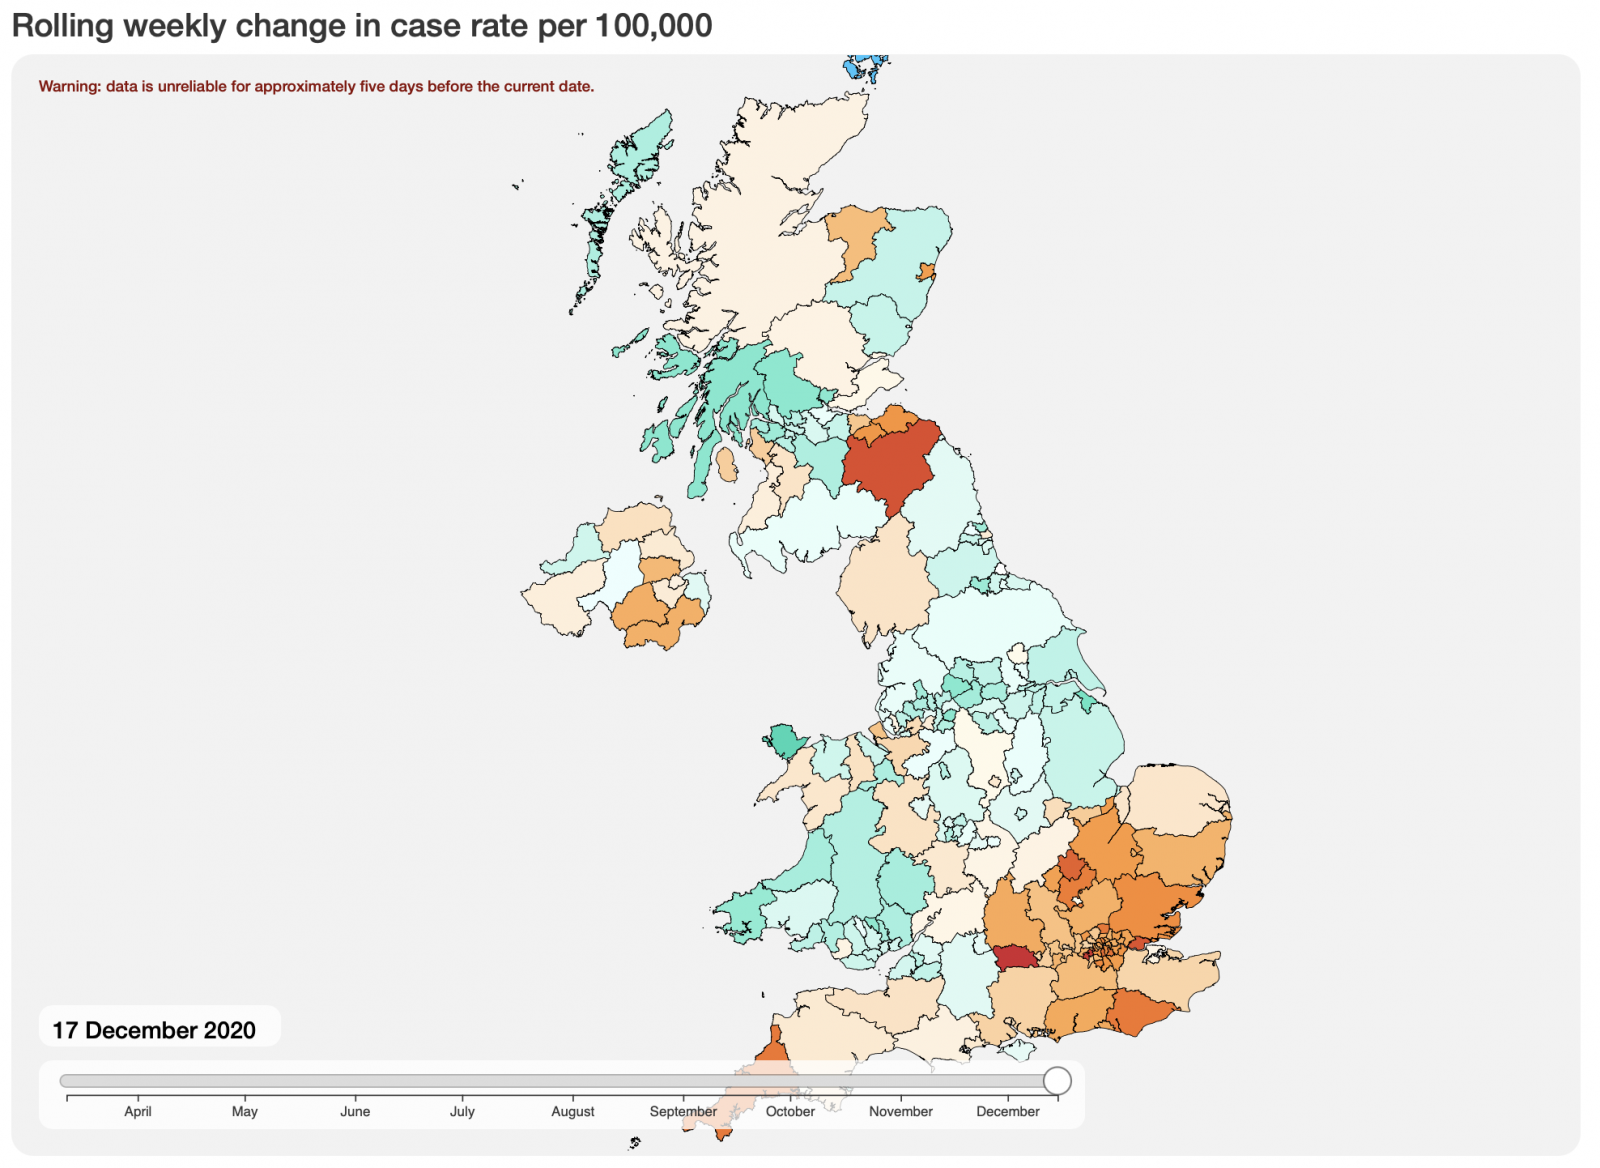
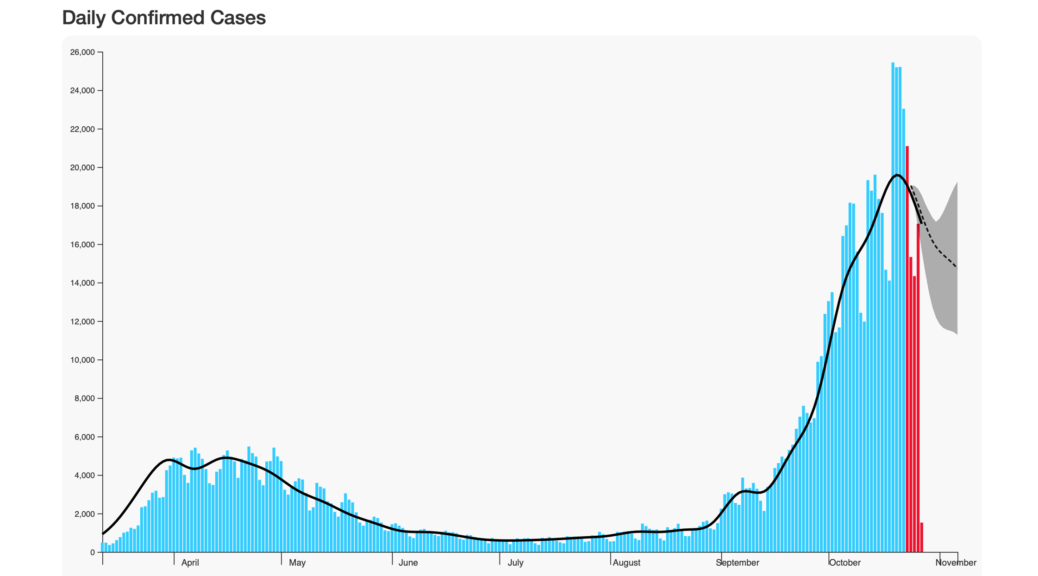
Some parts of the UK are seeing increasing daily case numbers (first image) and a continuing increase in the rolling live case rate (the second image shows weekly case rate calculated per 100,000 population). 1
Time for a different approach?
We – as a society – had the opportunity to prevent SARS-CoV-2 becoming endemic. We largely wasted it, initially by not locking down early enough or for long enough to remove it from the population. Nor did we use the lockdown period to set up effective data collection, testing, tracking and analytic tools to enable rapid and fine-grained response to predicted changes in incidence (it’s a truism that, by the time you’re working with actual data, you’re already behind in your response).
Public policy decisions are therefore based on incomplete and lagging data, partial models and on individual and committee opinion (however well qualified the participants) rather than being informed by data-driven modelling of potential outcomes. We are also behaving as though we’re dealing with a static target rather than a continuously evolving situation, one where an unintended consequence of partial and incomplete restrictions is that it effectively selects for different strains of the virus, as it evolves to cope with changes in population behaviour. This virus, like any other, has been mutating since before it collided head-on with our species, and it continues to evolve as it seeks selective advantage in exploiting its human host population, at any given time. Continue reading Time for a different approach?
Damned (Official) Statistics…
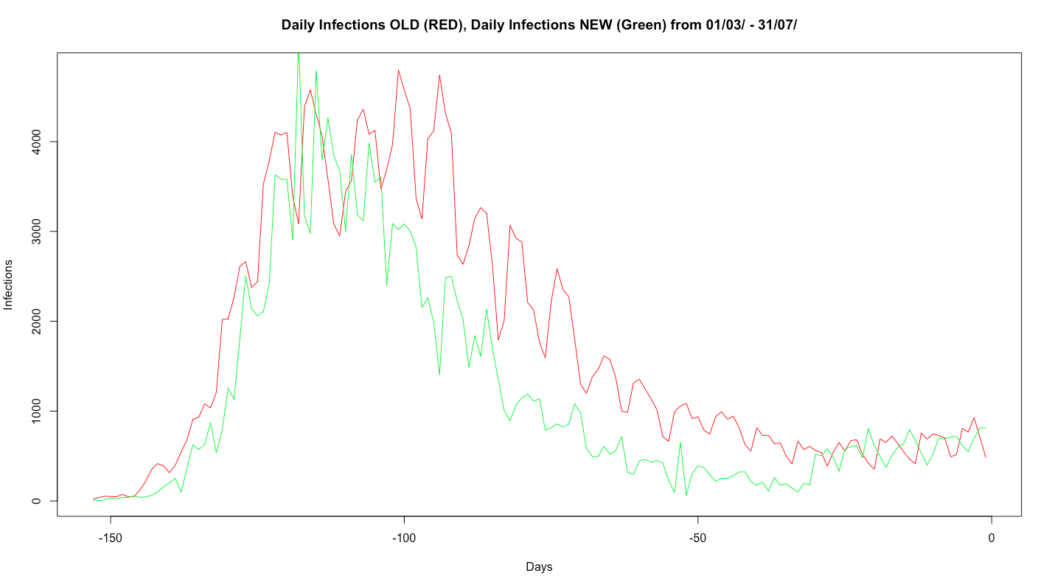
In developing our daily-predictive AI for Covid-19 infections , we’ve come across some, ah, interesting quirks in the official UK data: previously, we’d been using the government’s daily download data set for England, hoovering it into udu and thence driving the internal and R-based analytic and learning models. We’ve done the same for Scotland, Wales and Northern Ireland, from their respective data gateways, and merged the outcome to create a consistent baseline for analysis. Overall then, a bit clumsy, but perfectly workable. Continue reading Damned (Official) Statistics…
Two Worlds wins research funding for Covid-19 Intelligent Analytics
Two Worlds is one of the successful applicants to a £40M fund created to support “Business-led innovation in response to global disruption”, a competition that attracted 8,600 applicants. Working with a team including epidemiologists, mathematical modelling specialists and the Department of Computer Science at Imperial College, Two Worlds is using udu’s intelligent analytic software to tackle this problem. Continue reading Two Worlds wins research funding for Covid-19 Intelligent Analytics

