Another Friday update: we’re well into our private Beta of our predictive analytics and what-if? modelling system for Covid-19 analytics.
So what is it telling us today?
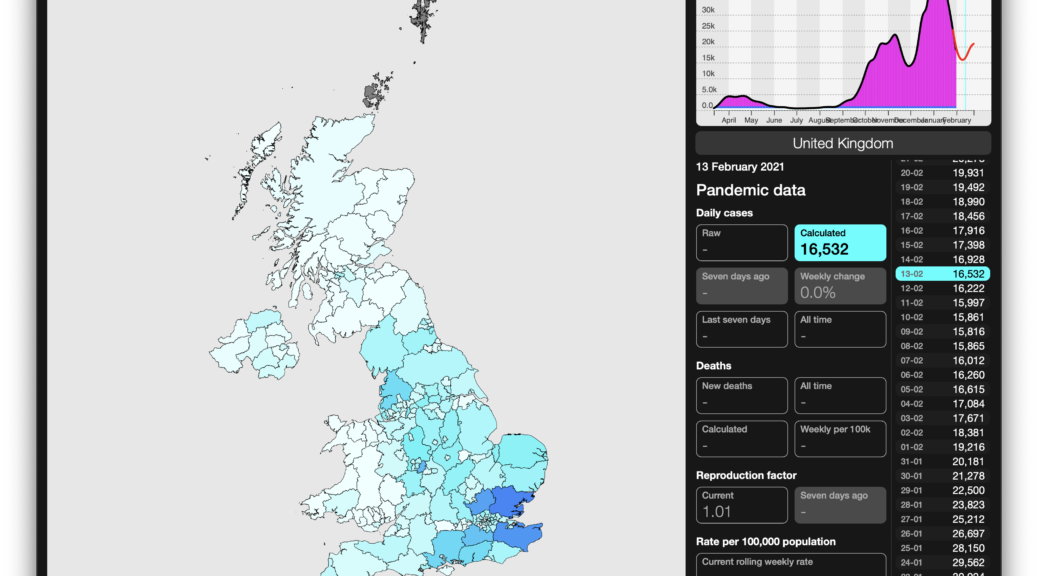
As of 3rd February our projections are (within their confidence limits, which of course become broader the further out we look, even if the central projection is tracking the reality curve well), that the R number bottoms out about now for the UK as a whole, with case numbers continuing to fall until around the 9th, by which time R number is back to .92 and, by the 13th, it’s more likely to be above 1 again, mostly driven by the SE (Essex particularly) and Merseyside (see header picture).
Next blindingly reasonable question is how much confidence we place in our forecasts? Well, as a rough rule of thumb, the more data we’ve got for an area (particularly it having a goodly number of cases throughout the pandemic) the better our forecasts are. So we can’t really do a proper forecast for Na h-Eileanan Siar (as opposed to historic or near-live analysis), ‘cos the numbers are too low.
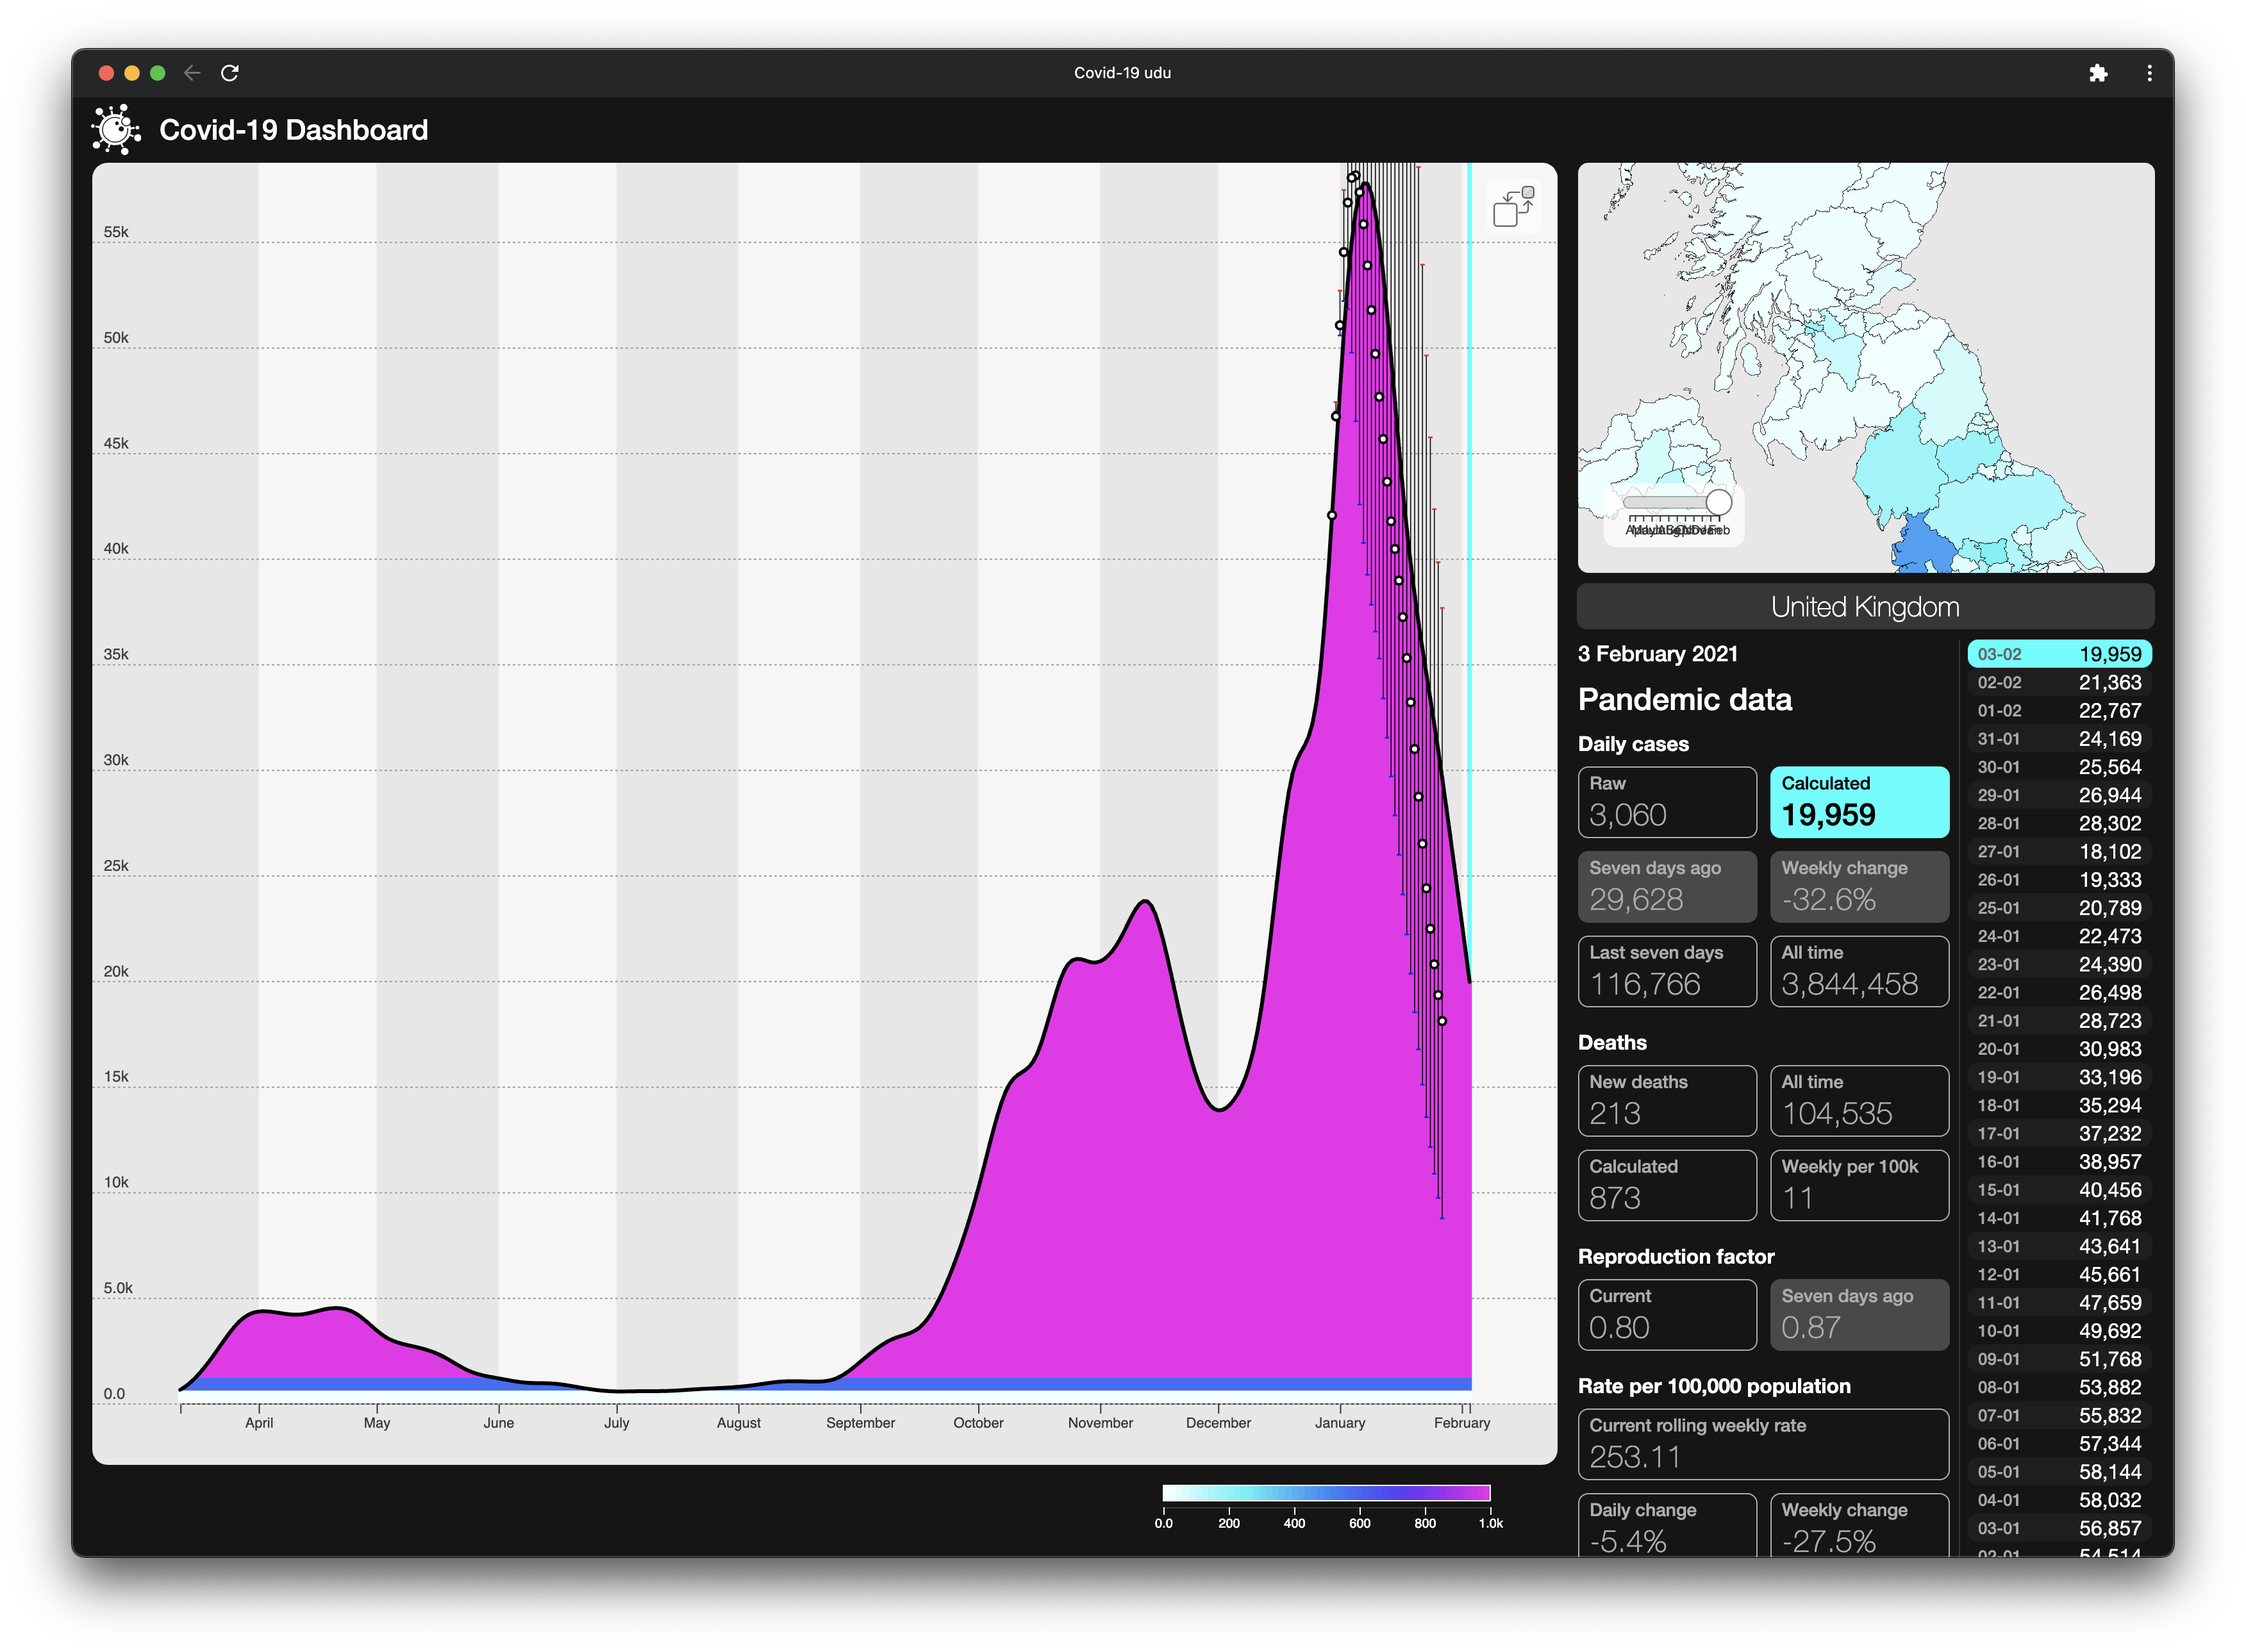
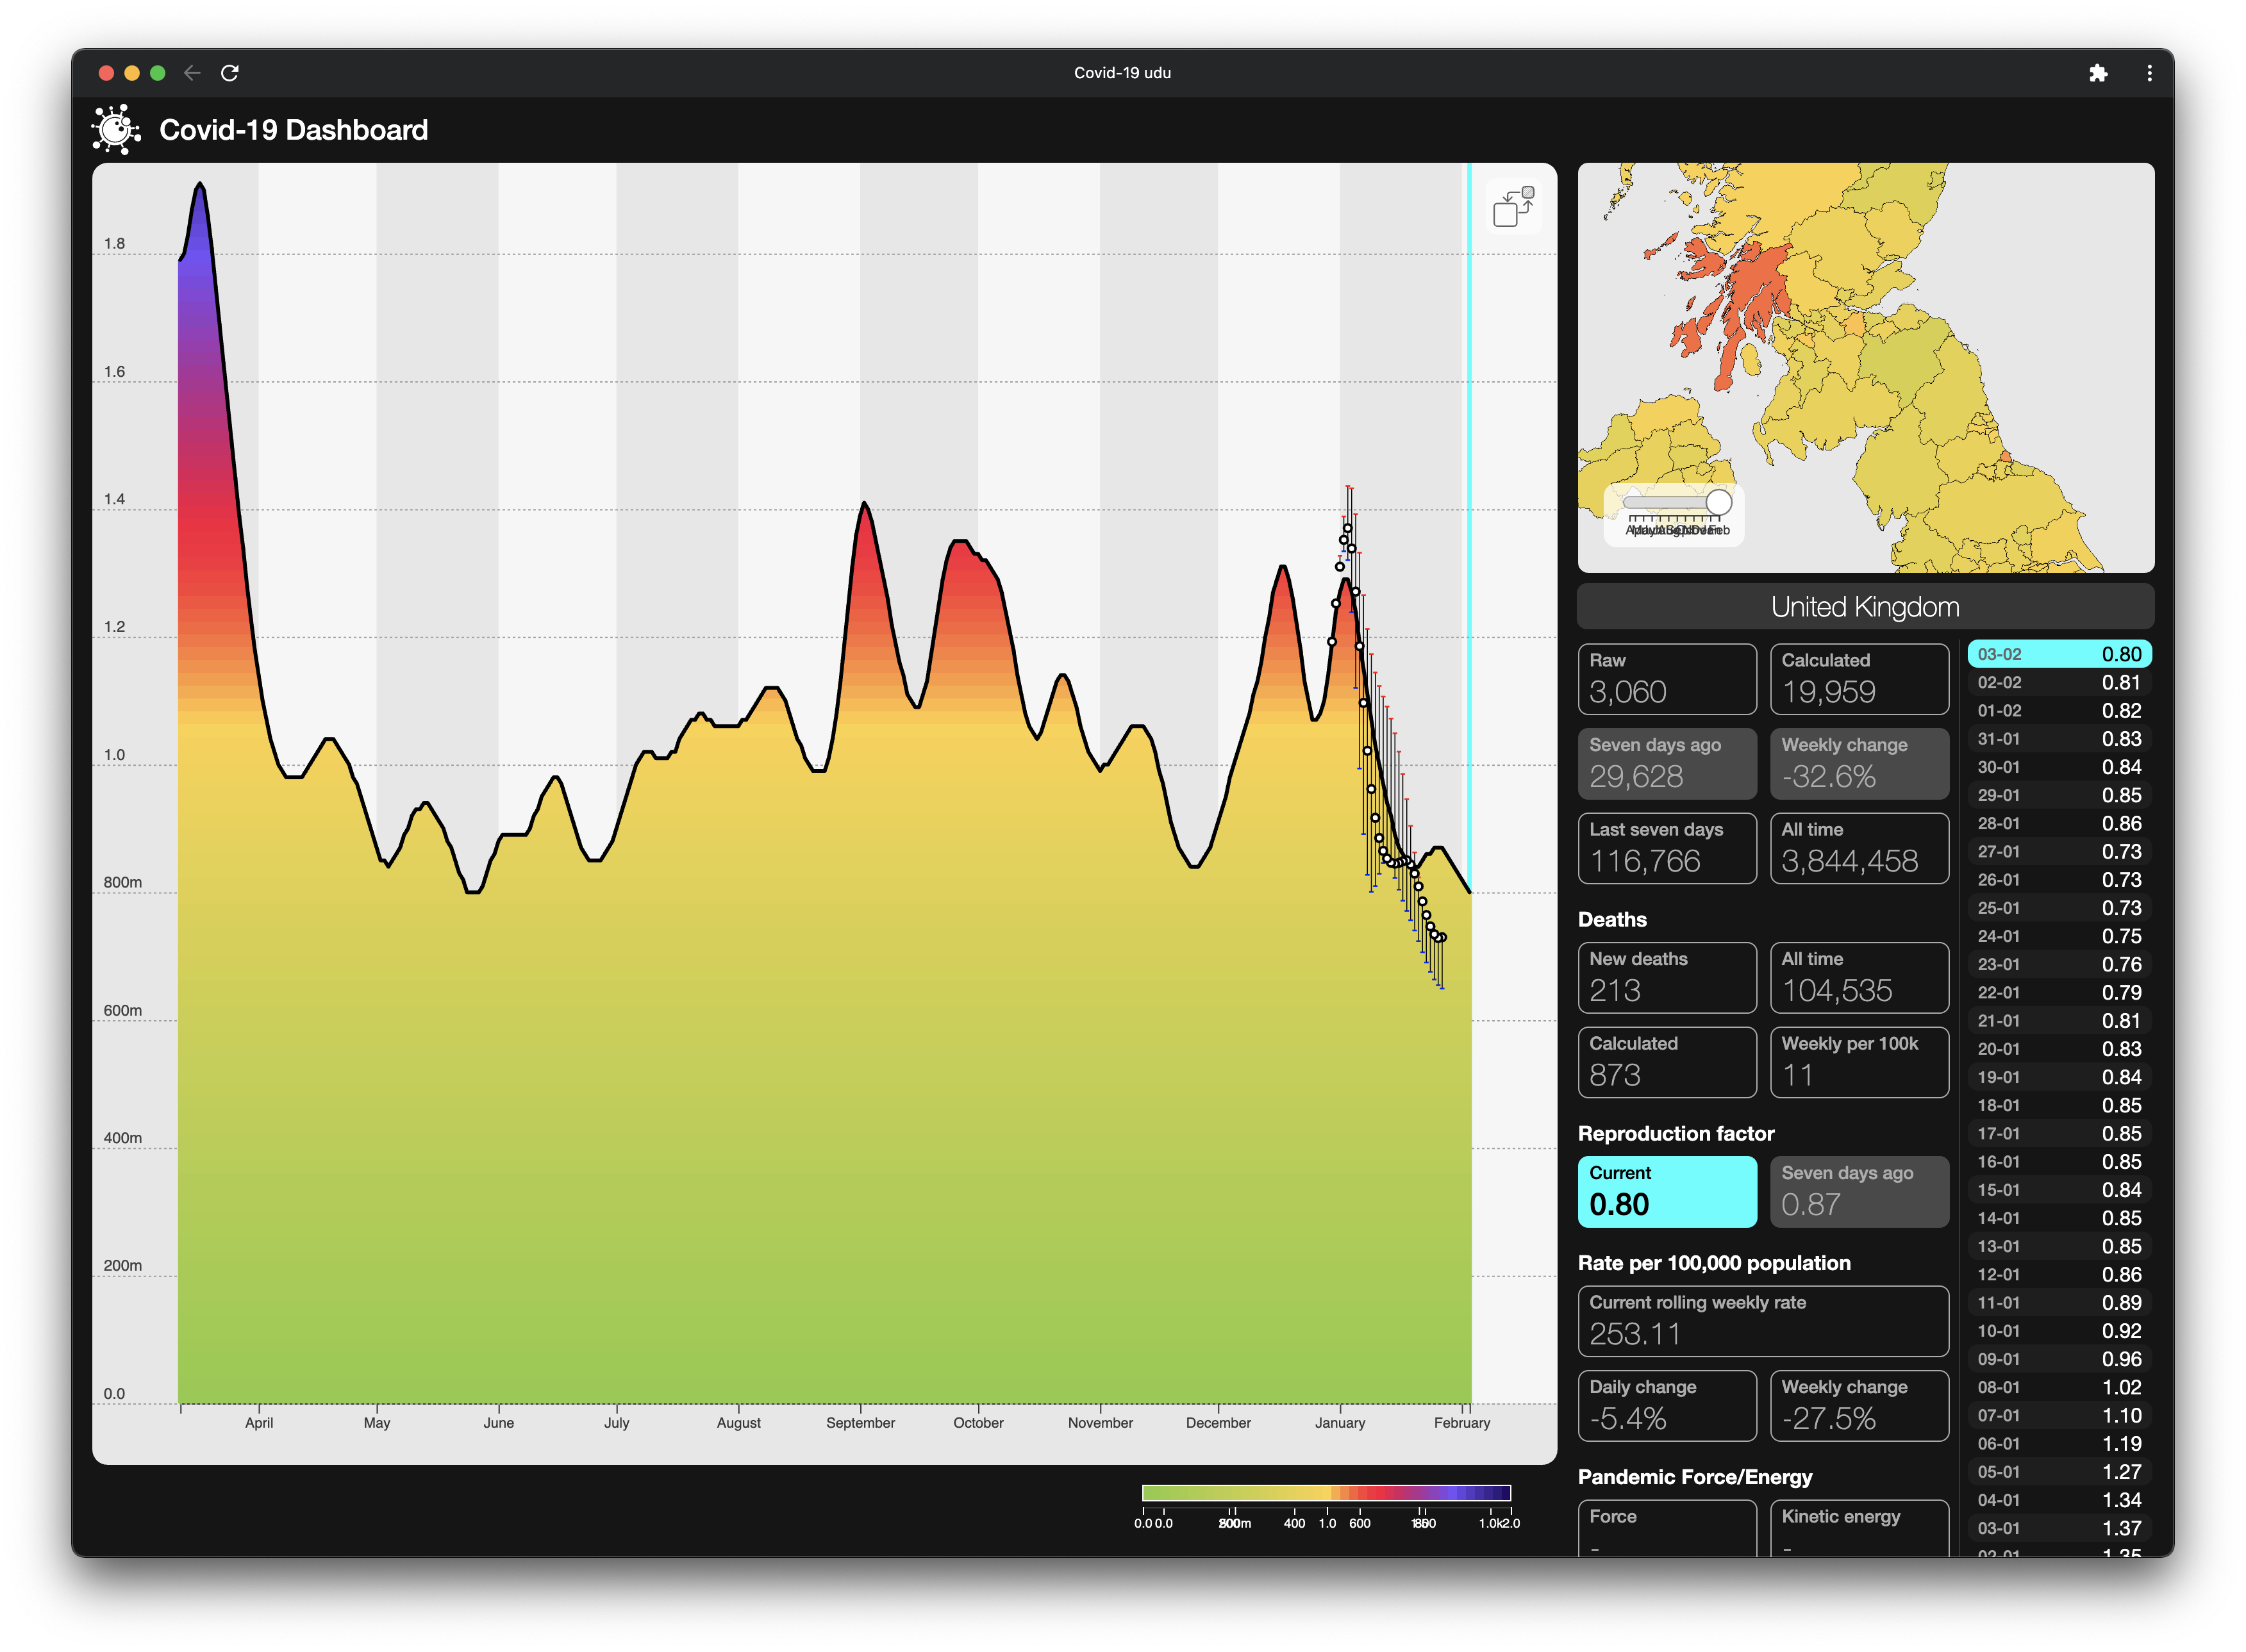
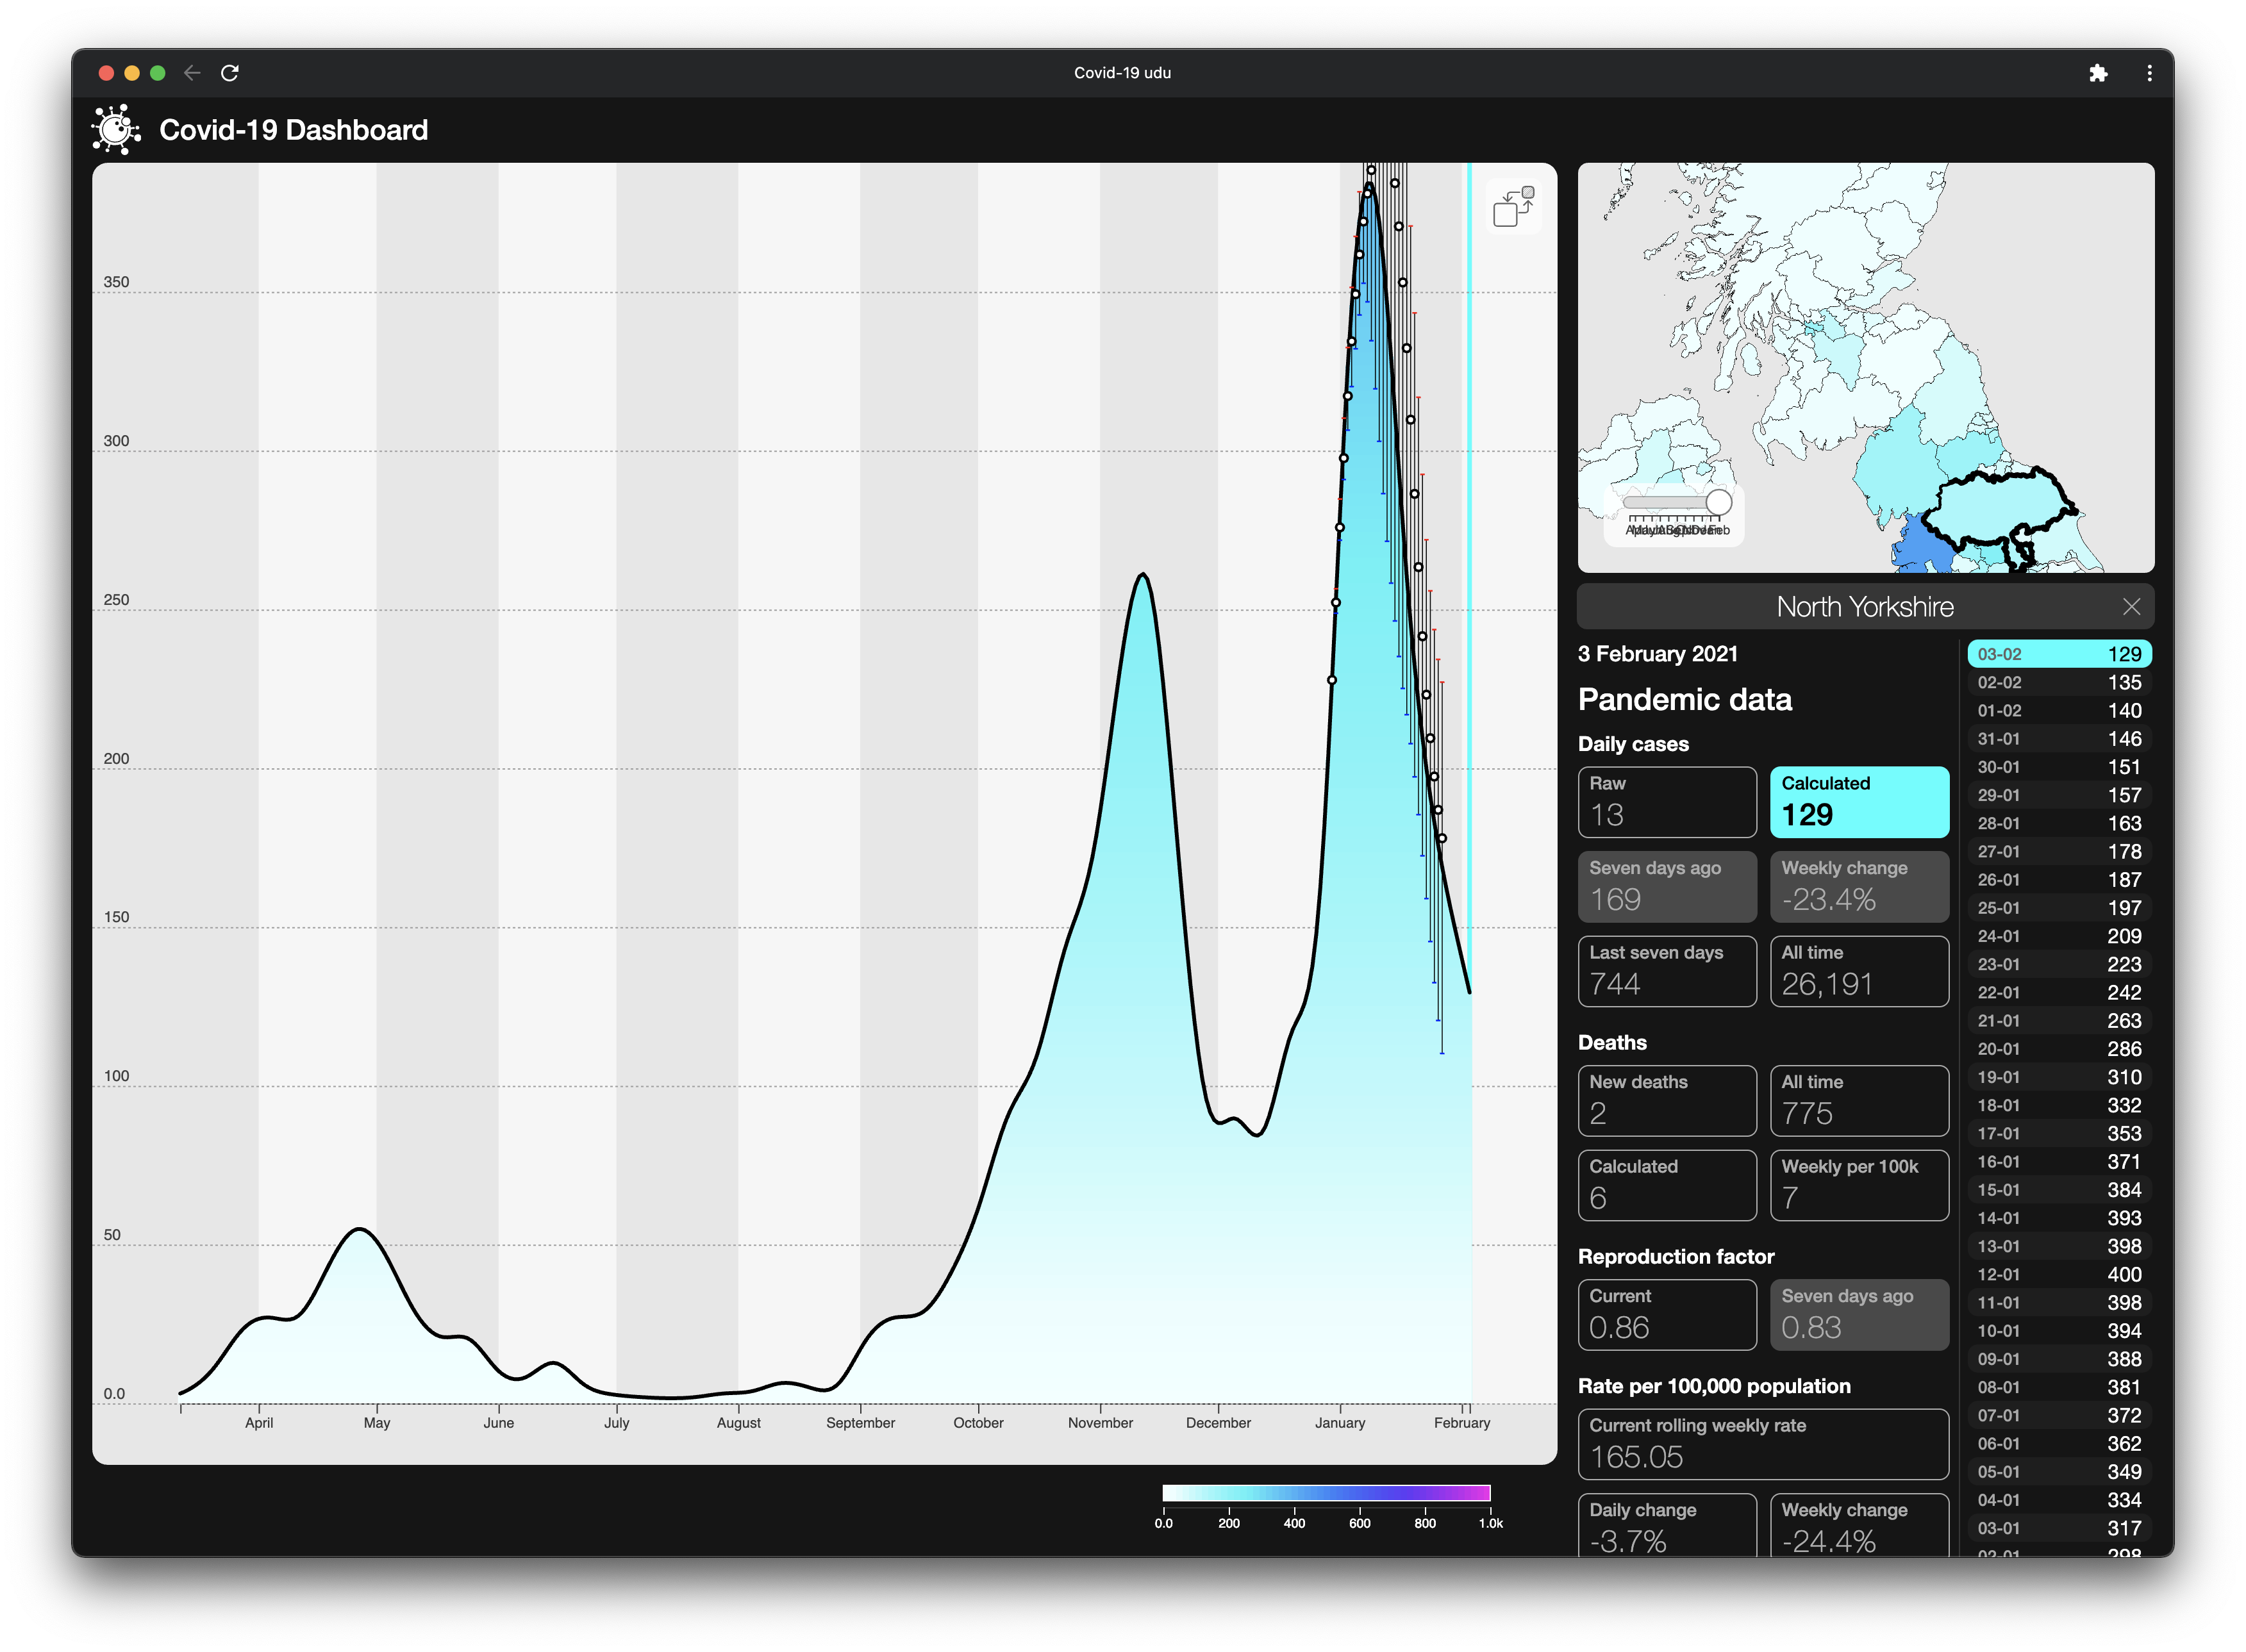
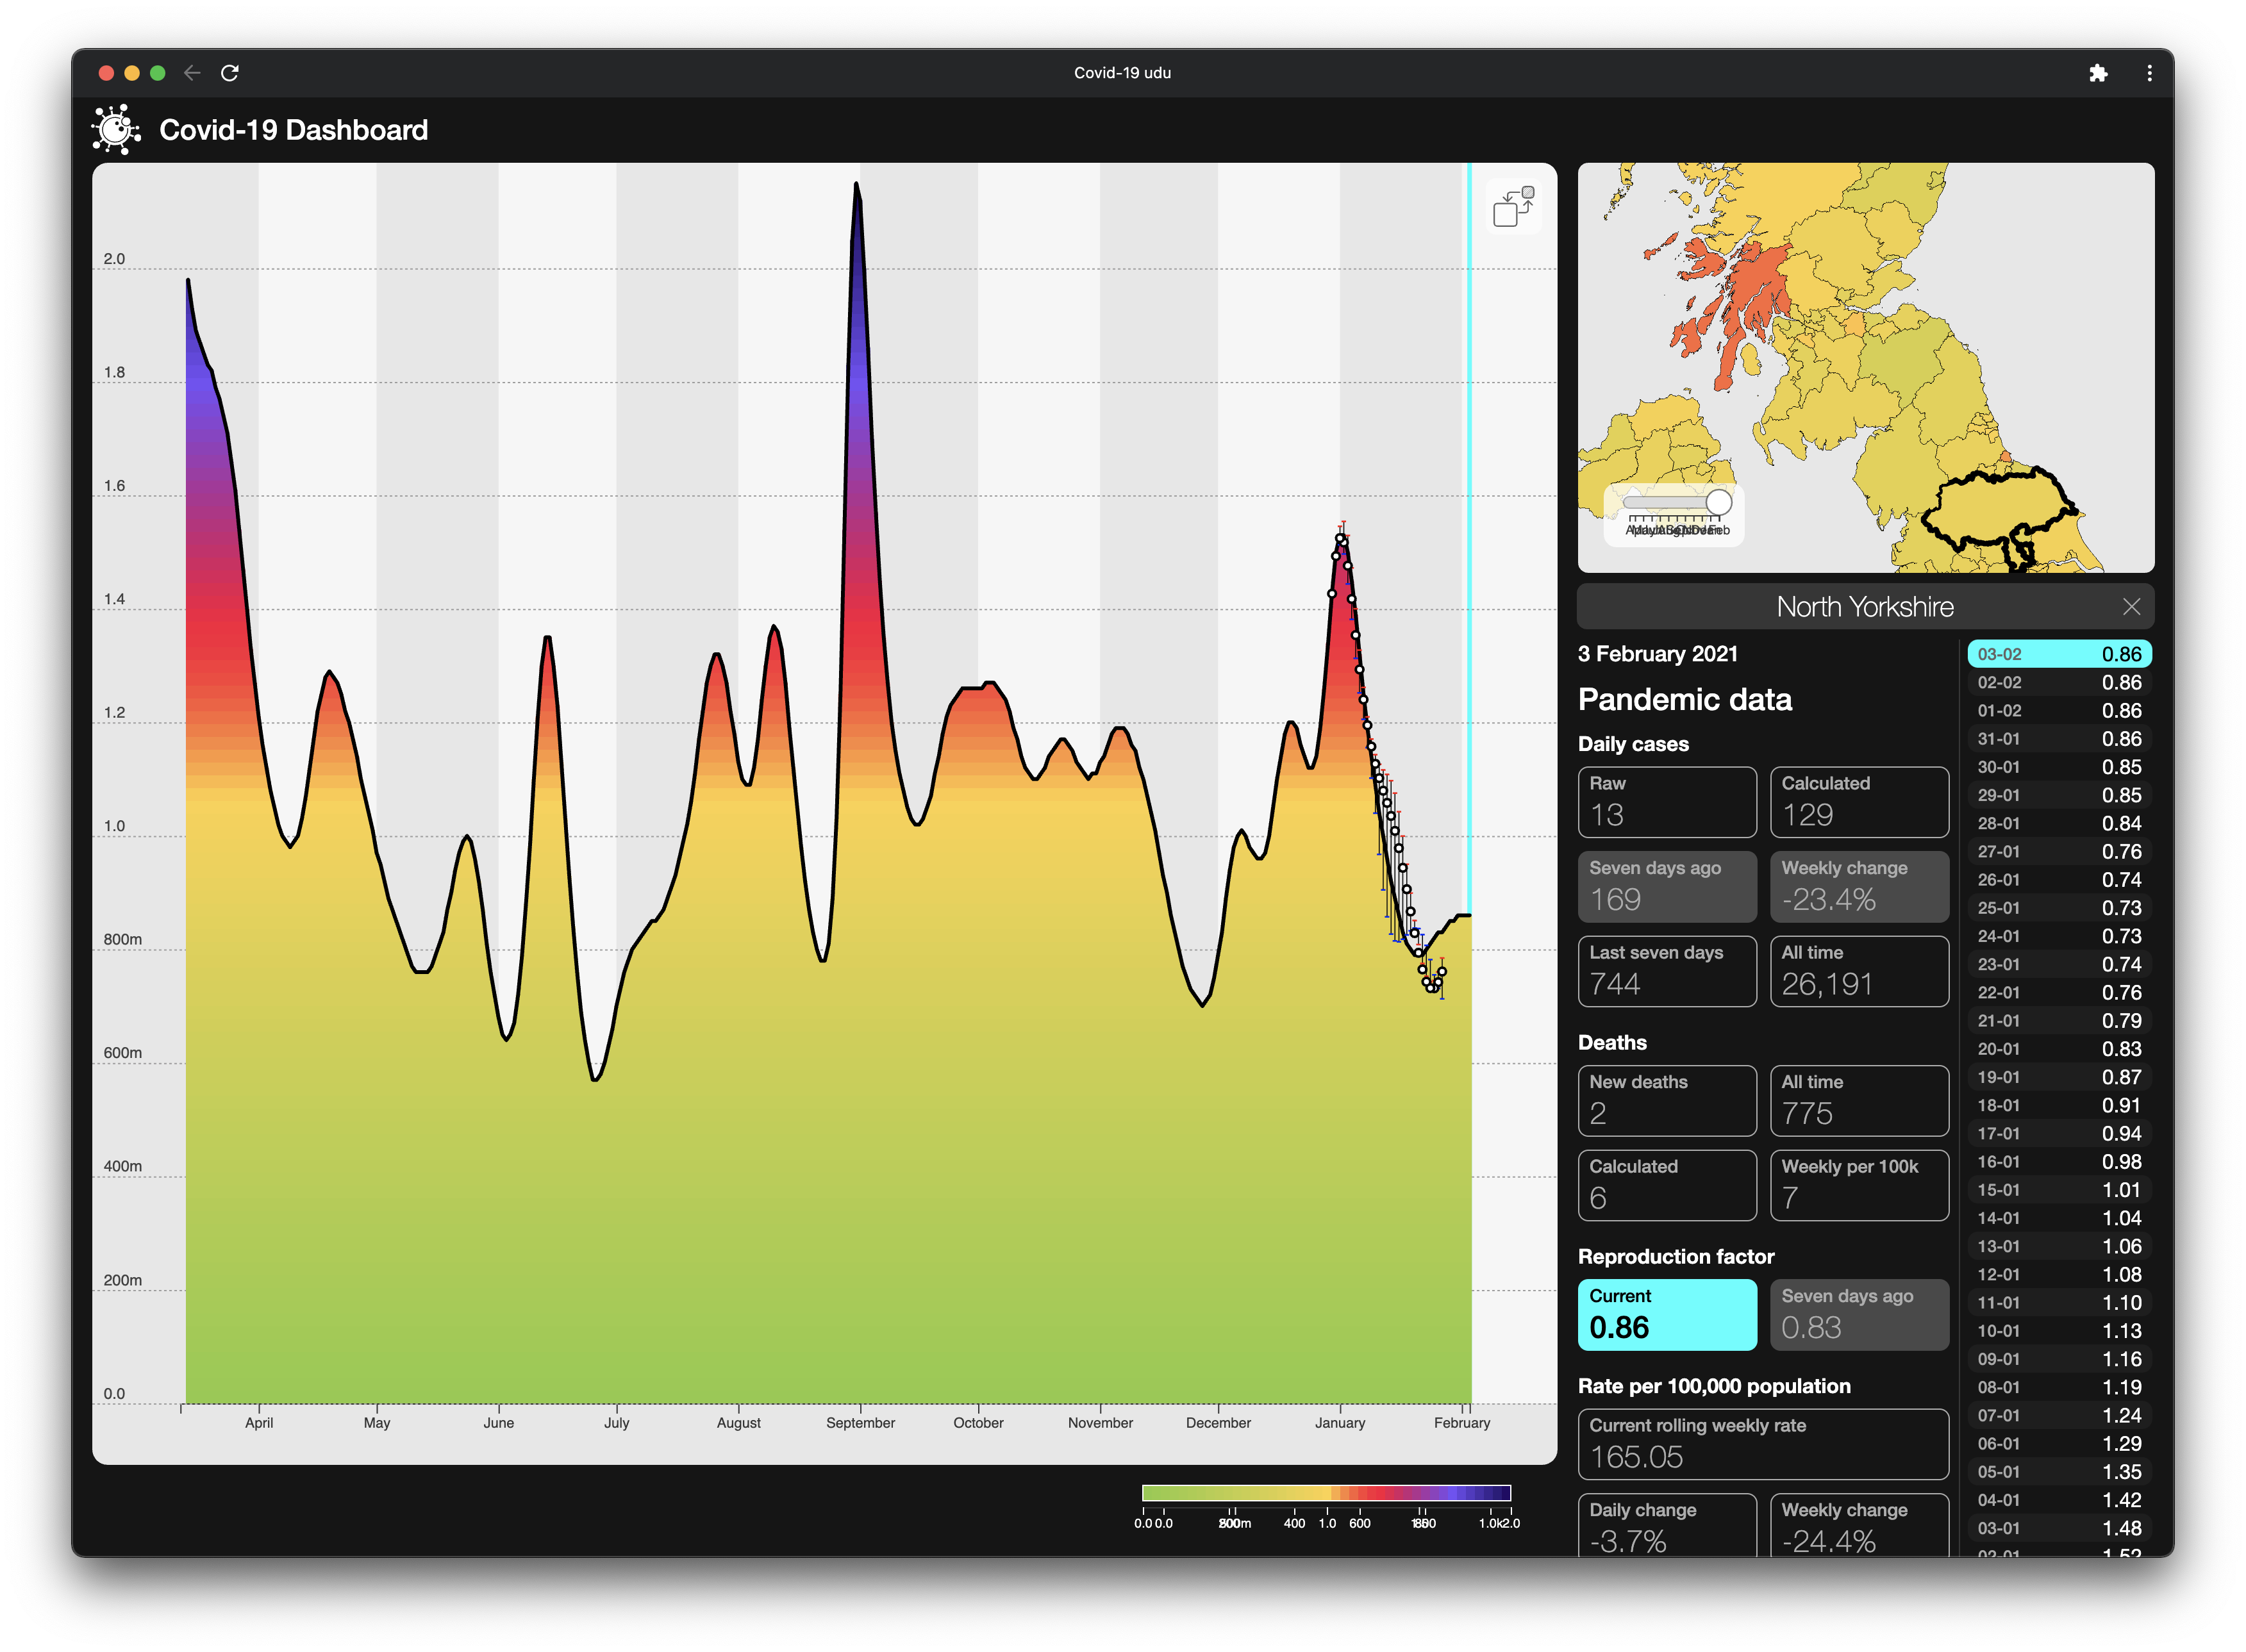
When we get onto the more populous areas or look at the UK, Country or Regional level, the match starts to look a much better: in these images, for the UK as a whole and for North Yorkshire, the solid line is our prediction for cases and R number, and the dotted line with the confidence bars is what we forecast for 28 days ahead from 30 December.
Our local area, Stirling, is somewhere in between – more data than , but we’re still not exactly a hotbed of the pandemic here, so the fit is a little more approximate. The gaps in the historical R Factor calculation are where the numbers have dropped below the point where it’s possible to calculate a local R Factor.
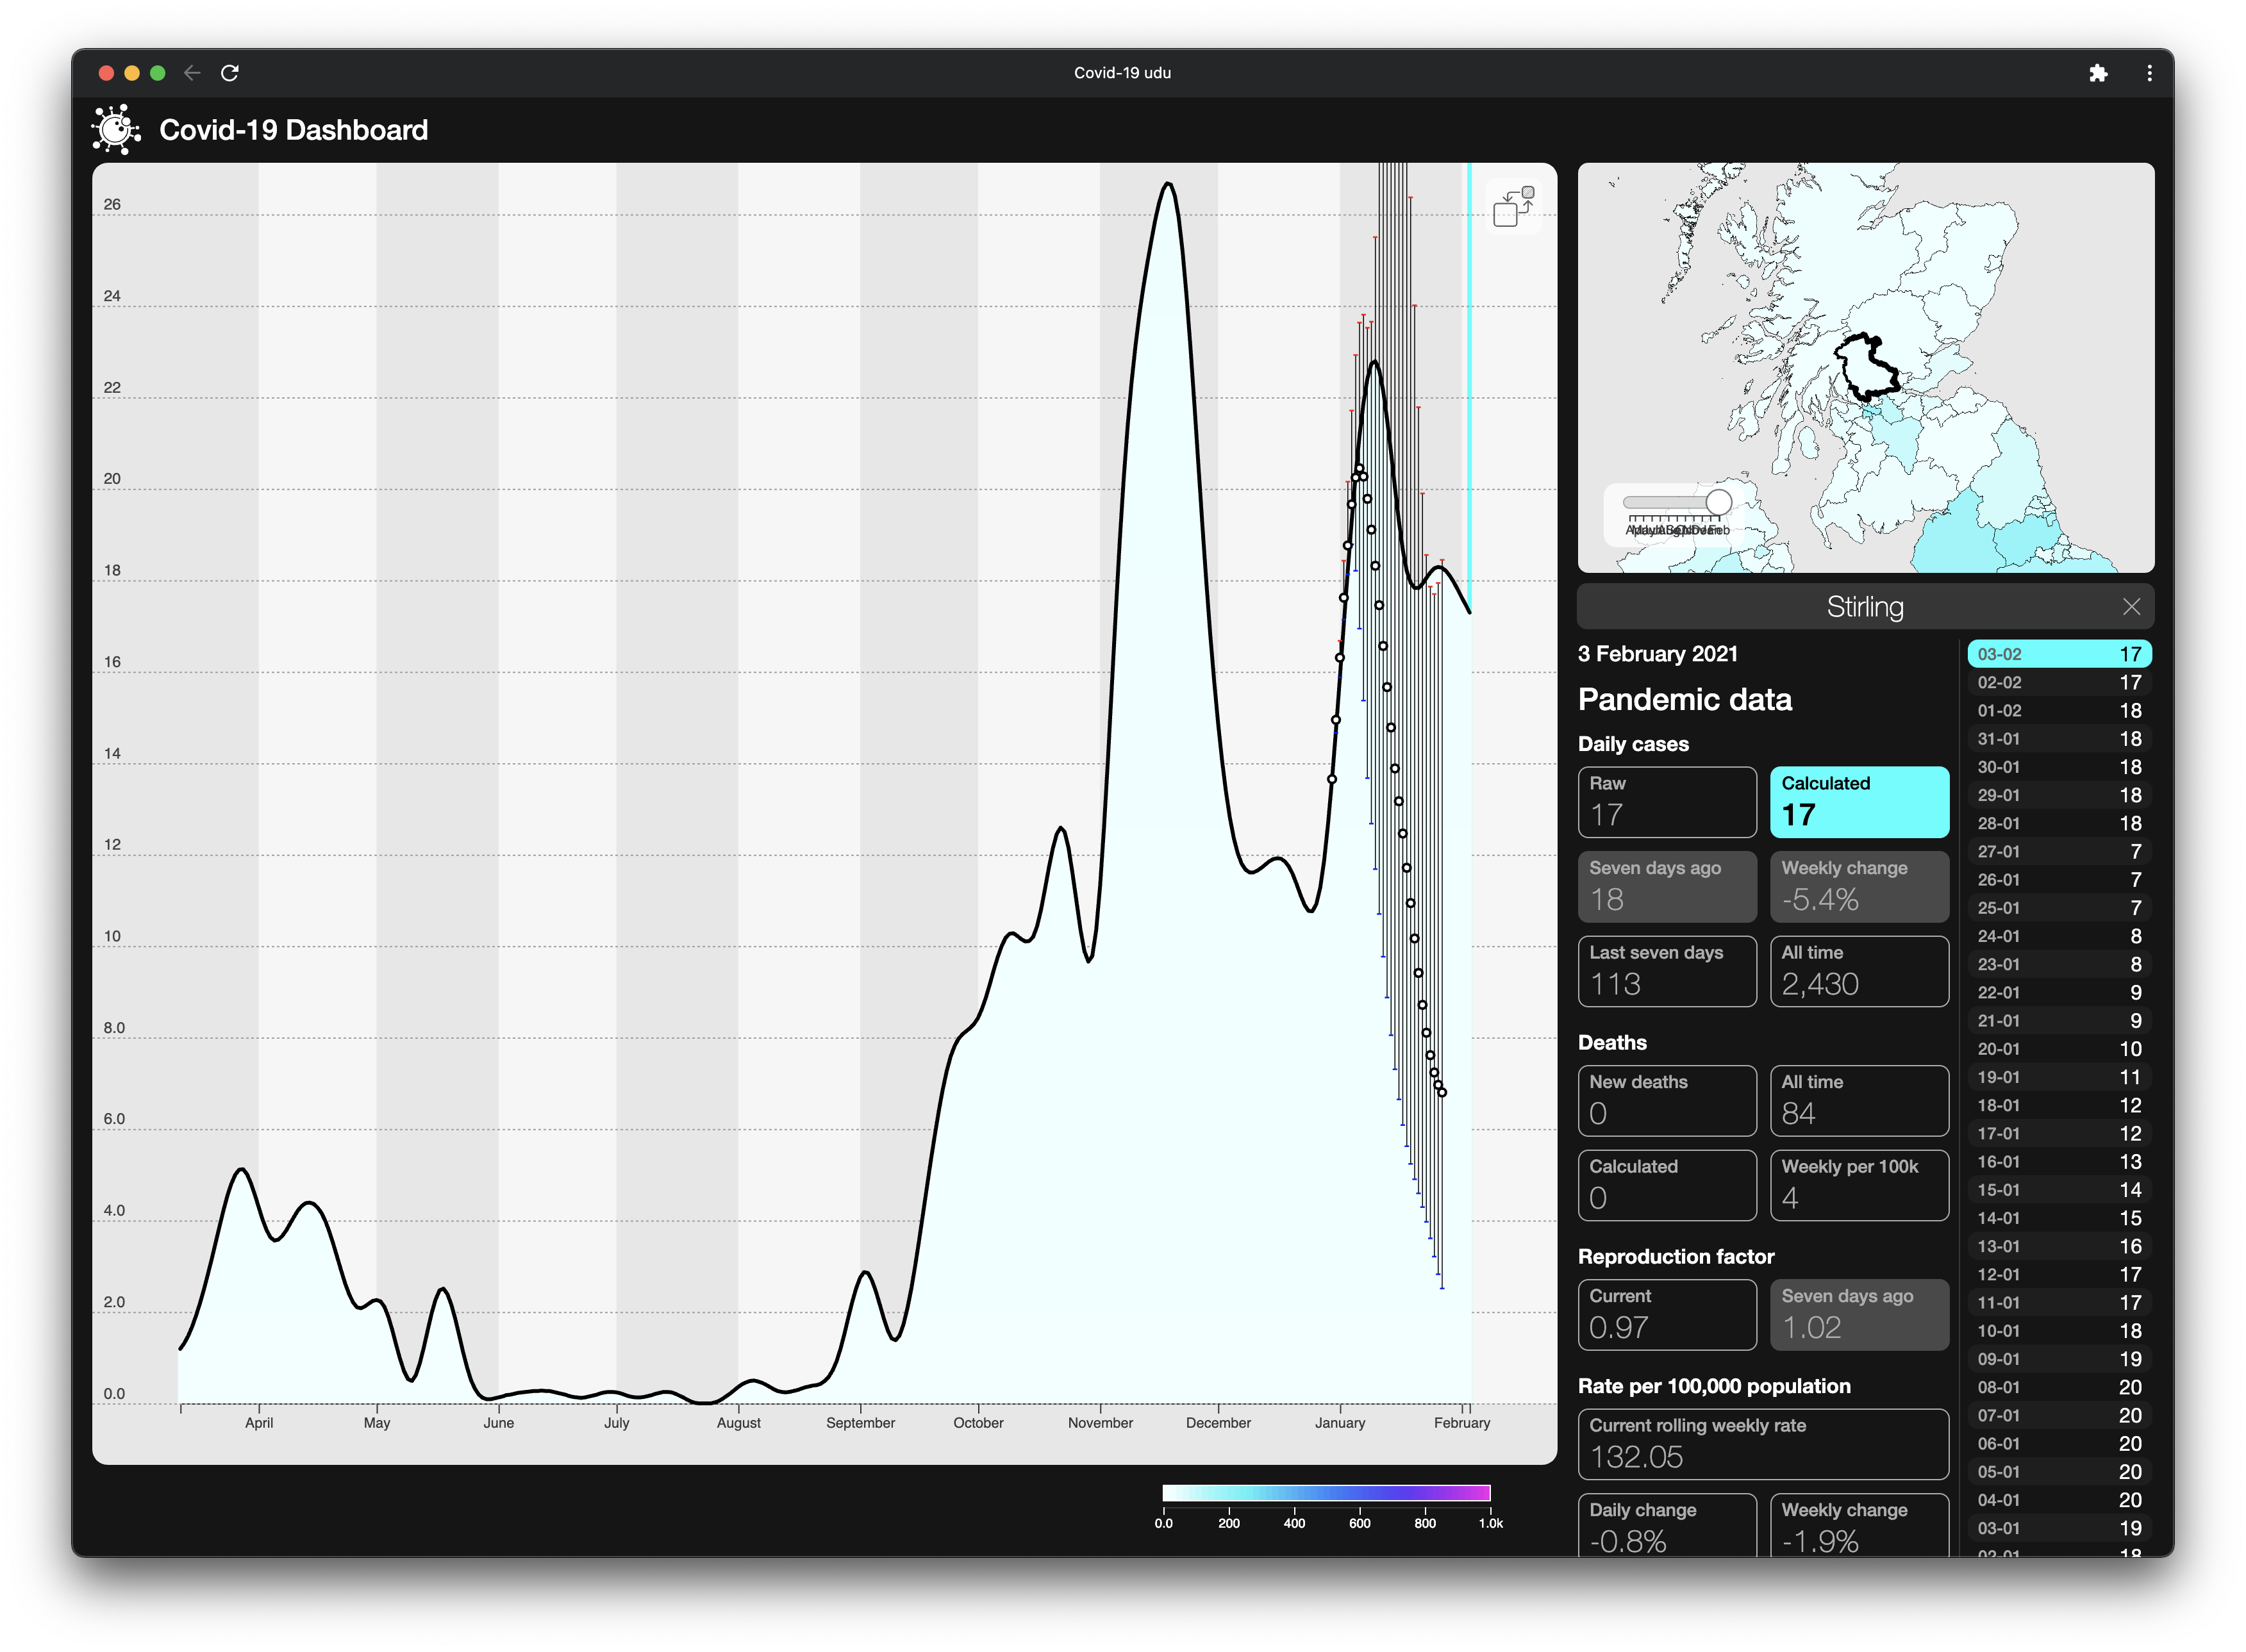
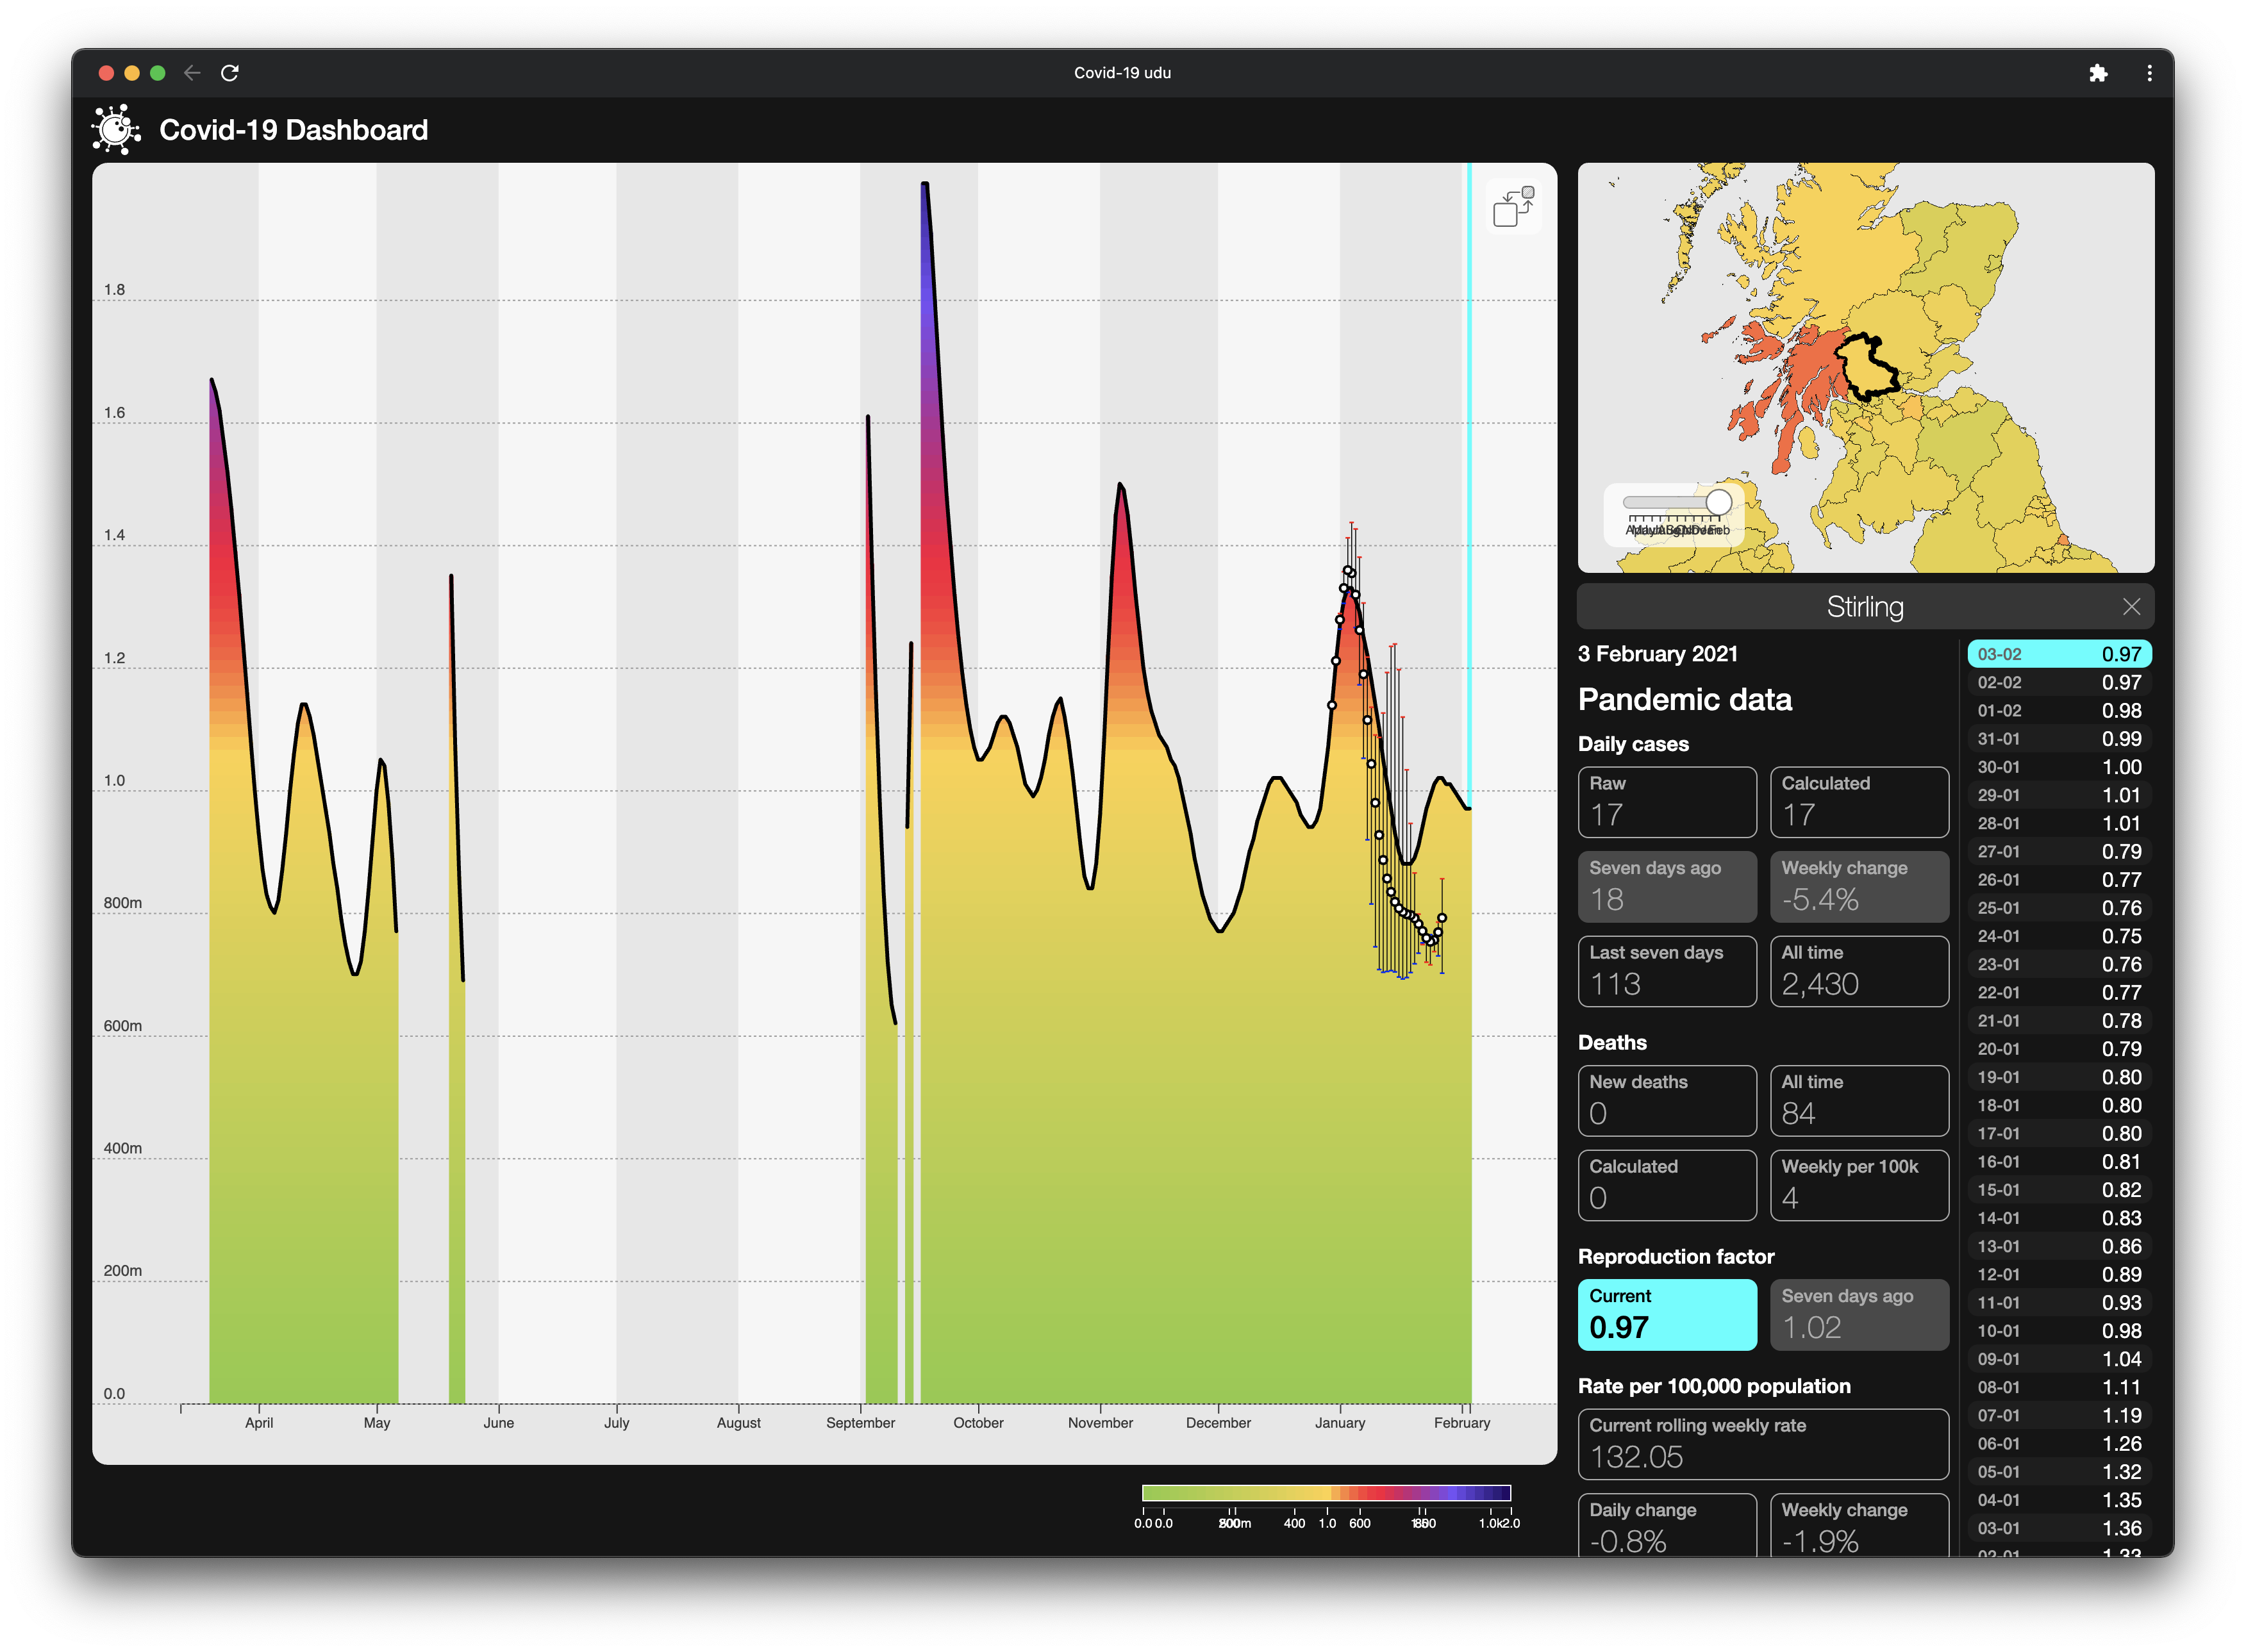
Take from that what you will, but we’re starting to develop quite a lot of confidence in our system.
Development of Two Worlds’ analytic platform for the Covid-19 pandemic is supported by InnovateUK under R&D grants 54368 and 93341.

