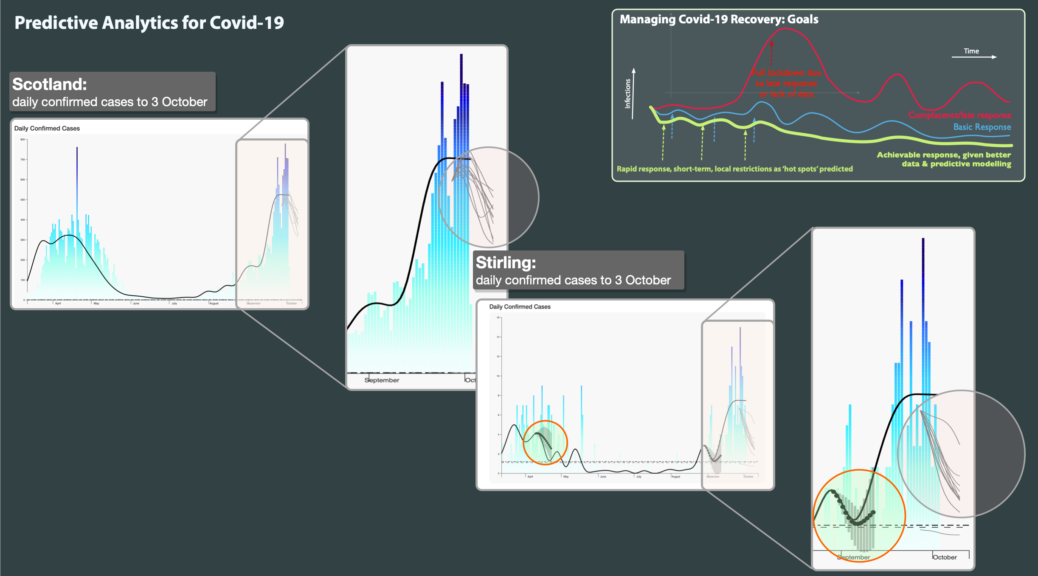
Over the last few months, we have been using advanced data intelligence to improve the sourcing, timeliness and validation of Covid-19 statistics. We then use our emergent and adaptive platform to provide high quality predictive modelling of its likely progress.
Human nature being what it is, people have become somewhat desensitised to raw numbers and to the differences between the first surge of the virus in March-May and where we are now, despite that difference being genuinely scary, as any front line medic will confirm, if they still have the energy. So anything that helps communicate the current situation more effectively can only help – this is one of our alpha stage experiments, animating the rolling case rate per 100,000 population for the UK, from March 12 2020 to January 5 2021.
Note that we use case figures that are compensated for reporting irregularities using a mathematical model that does so without losing data – it’s more accurate than the simple moving averages (SMA) on which the government seems to base its calculations. We do use SMAs, but only in conjunction with other indicators, to look for inflection points in the data over time.
Systems such as ours (and, having tested it for several months, we have increasing confidence in knowing both its advantages and current limits) can improve the quality of presented data, can provide better predictions and can support the sort of what-if? modelling needed to turn policy response planning from ‘best guess’ to data-driven and evaluated. What we can’t do is control whether that actually gets used or not: you can lead a horse to water…
Development of Two Worlds’ analytic platform for the Covid-19 pandemic is supported by InnovateUK under R&D grants 54368 and 93341.