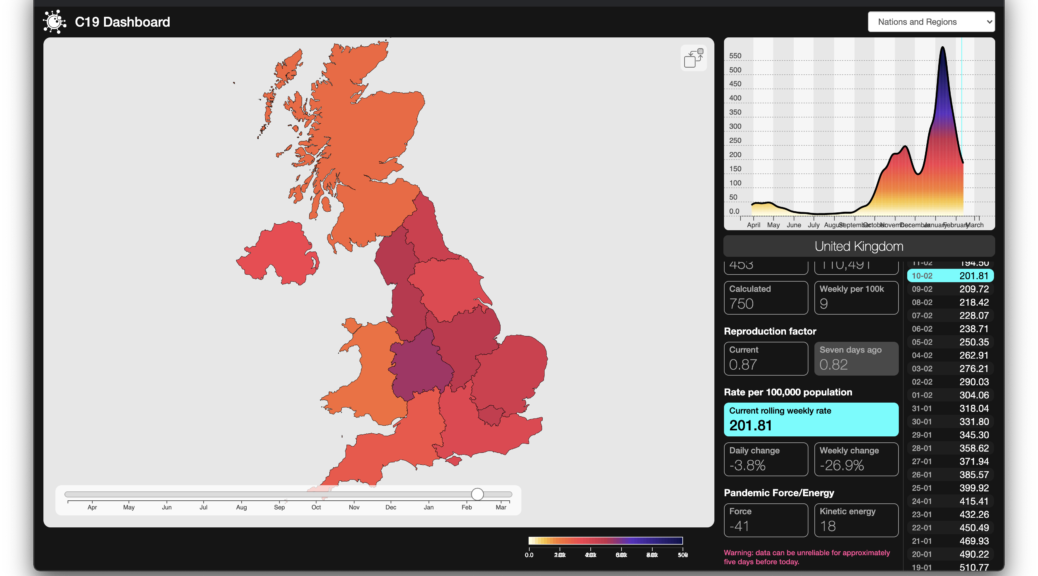
There’s been a lot of covoptimism this past week, from assorted government spokesfolks, including from people who do know what they’re talking about – a prime example being Prof. Neil Ferguson of Imperial. The theme here is that cases, case rates and the R number have been falling strongly and appear to be continuing to do so.
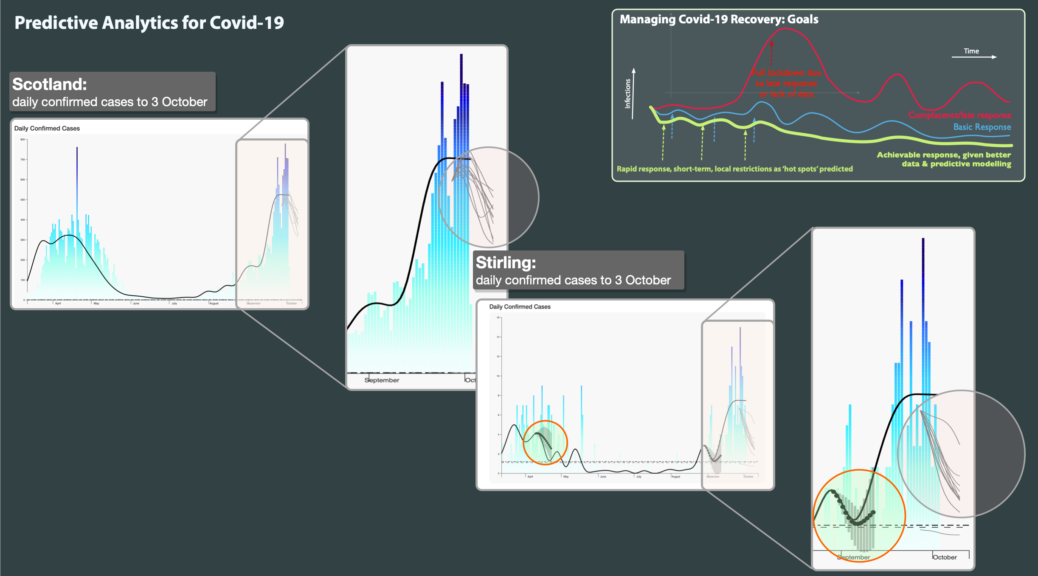
That’s true, to a point. But our modelling suggests that the immediate future is less rosy.
It’s not about the data – we use the same published sources as the government, albeit that they’ve got access to more sources than we do – it’s more about what you do with it.
Continue reading Proving a Point? →

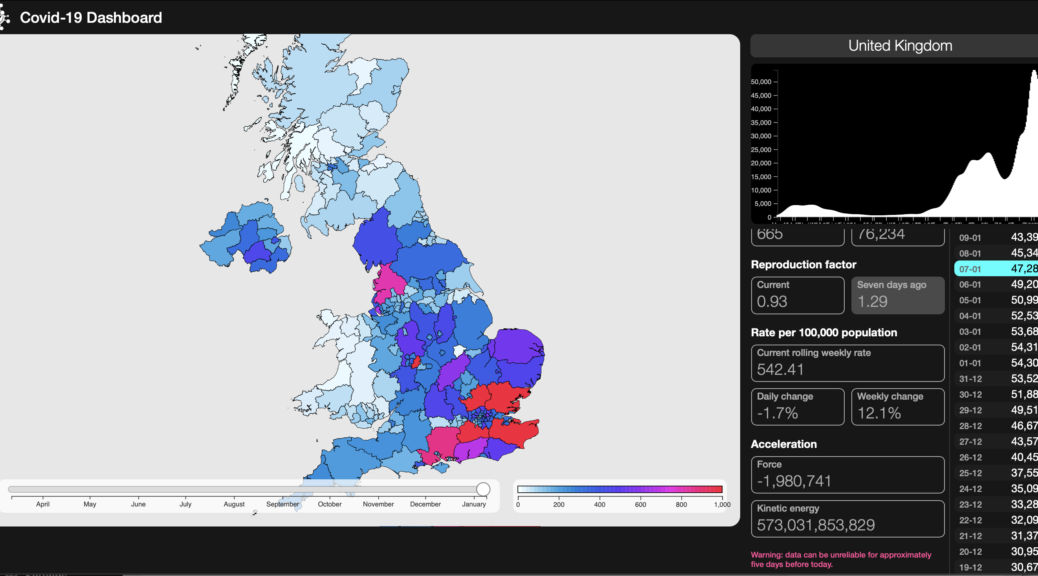
We’ve been thinking for some time about how best to present the dynamic of the pandemic in a way that actually shows what’s happening – the R number doesn’t give any idea of magnitude and is – in our opinion – best kept behind the scenes as a contributor to analytic models, raw or compensated case numbers are just that – daily records – shocking enough in themselves but they still don’t show the energy in the thing. Continue reading Kinetics of a Pandemic →

Over the last few months, we have been using advanced data intelligence to improve the sourcing, timeliness and validation of Covid-19 statistics. We then use our emergent and adaptive platform to provide high quality predictive modelling of its likely progress.
Human nature being what it is, people have become somewhat desensitised to raw numbers and to the differences between the first surge of the virus in March-May and where we are now, despite that difference being genuinely scary, as any front line medic will confirm, if they still have the energy. So anything that helps communicate the current situation more effectively can only help – this is one of our alpha stage experiments, animating the rolling case rate per 100,000 population for the UK, from March 12 2020 to January 5 2021.
Continue reading Animating the UK →
Two Worlds is an AI research consultancy and incubator, specialising in complex, adaptive systems. We create strategies, technologies and services that encompass advanced data discovery and fusion AI/Machine Learning, IoT networks, augmented and mixed reality systems.


