Throughout the pandemic, we’ve watched UK government Covid-19 policy-making as it appears to follow a drunkard’s walk between, on the one hand, an inherent laziness of response and a politically-influenced disinclination to act and, on the other, an attempt to claim some sort of causal relationship with the scientific and real world advice that they’re being given. The core mantra apparently is to do nothing until it’s too late, then blame any combination of scientists, the wider population and random acts of nature for the outcome.
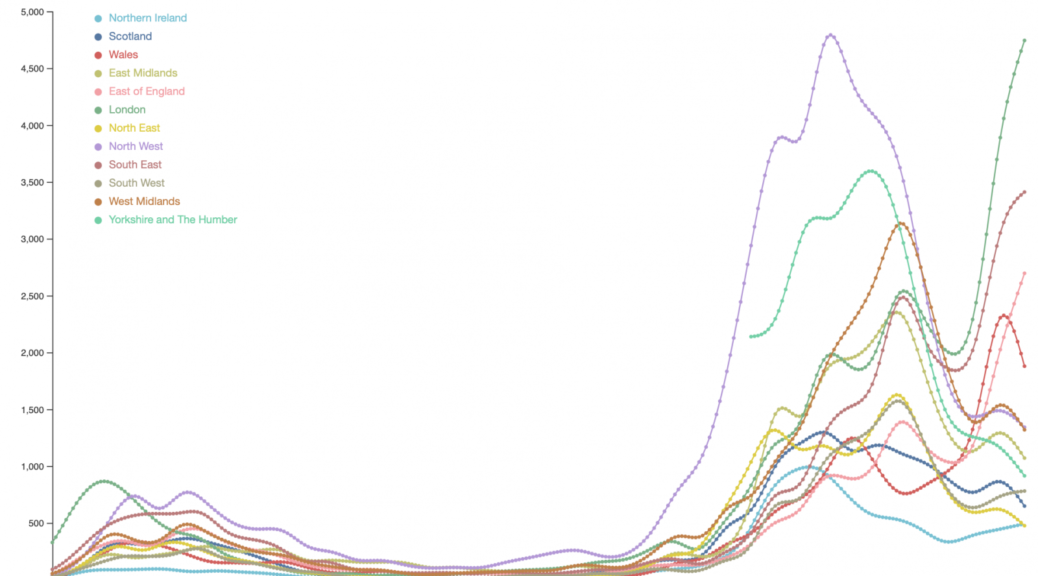
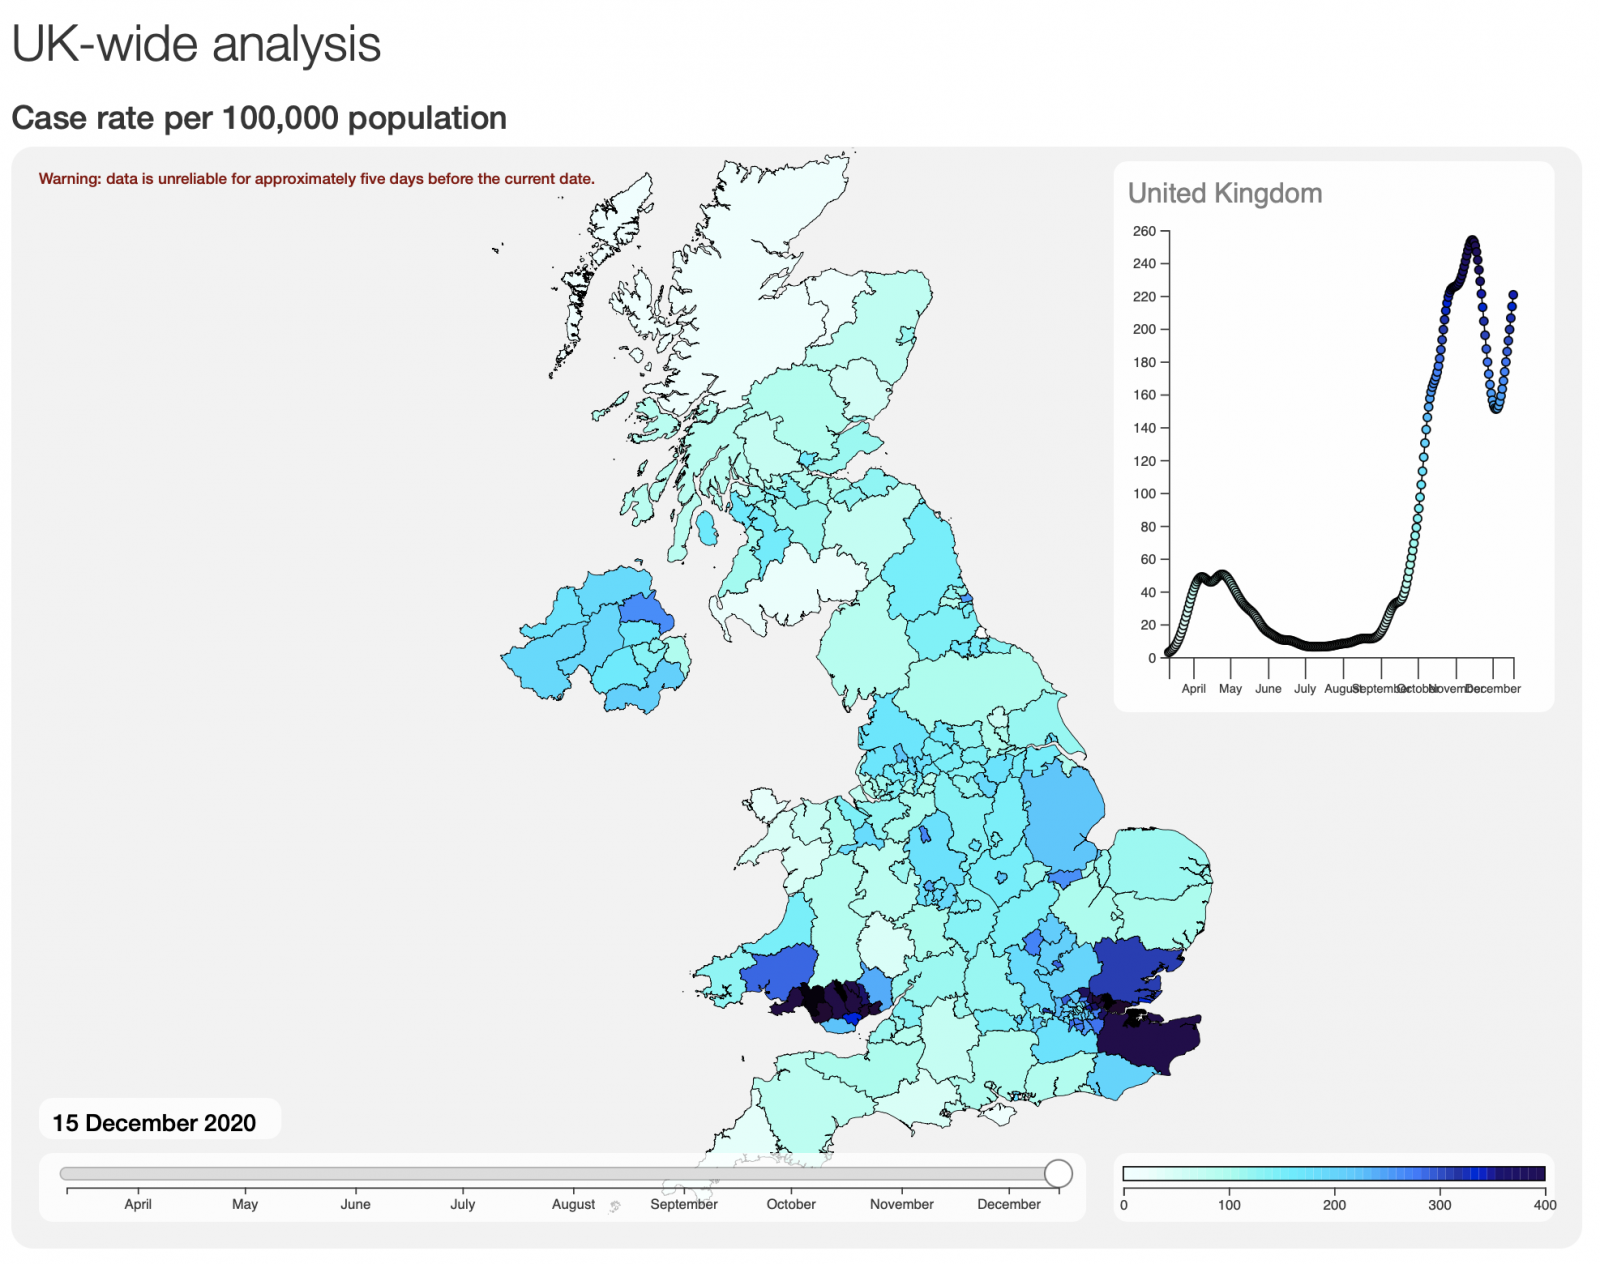
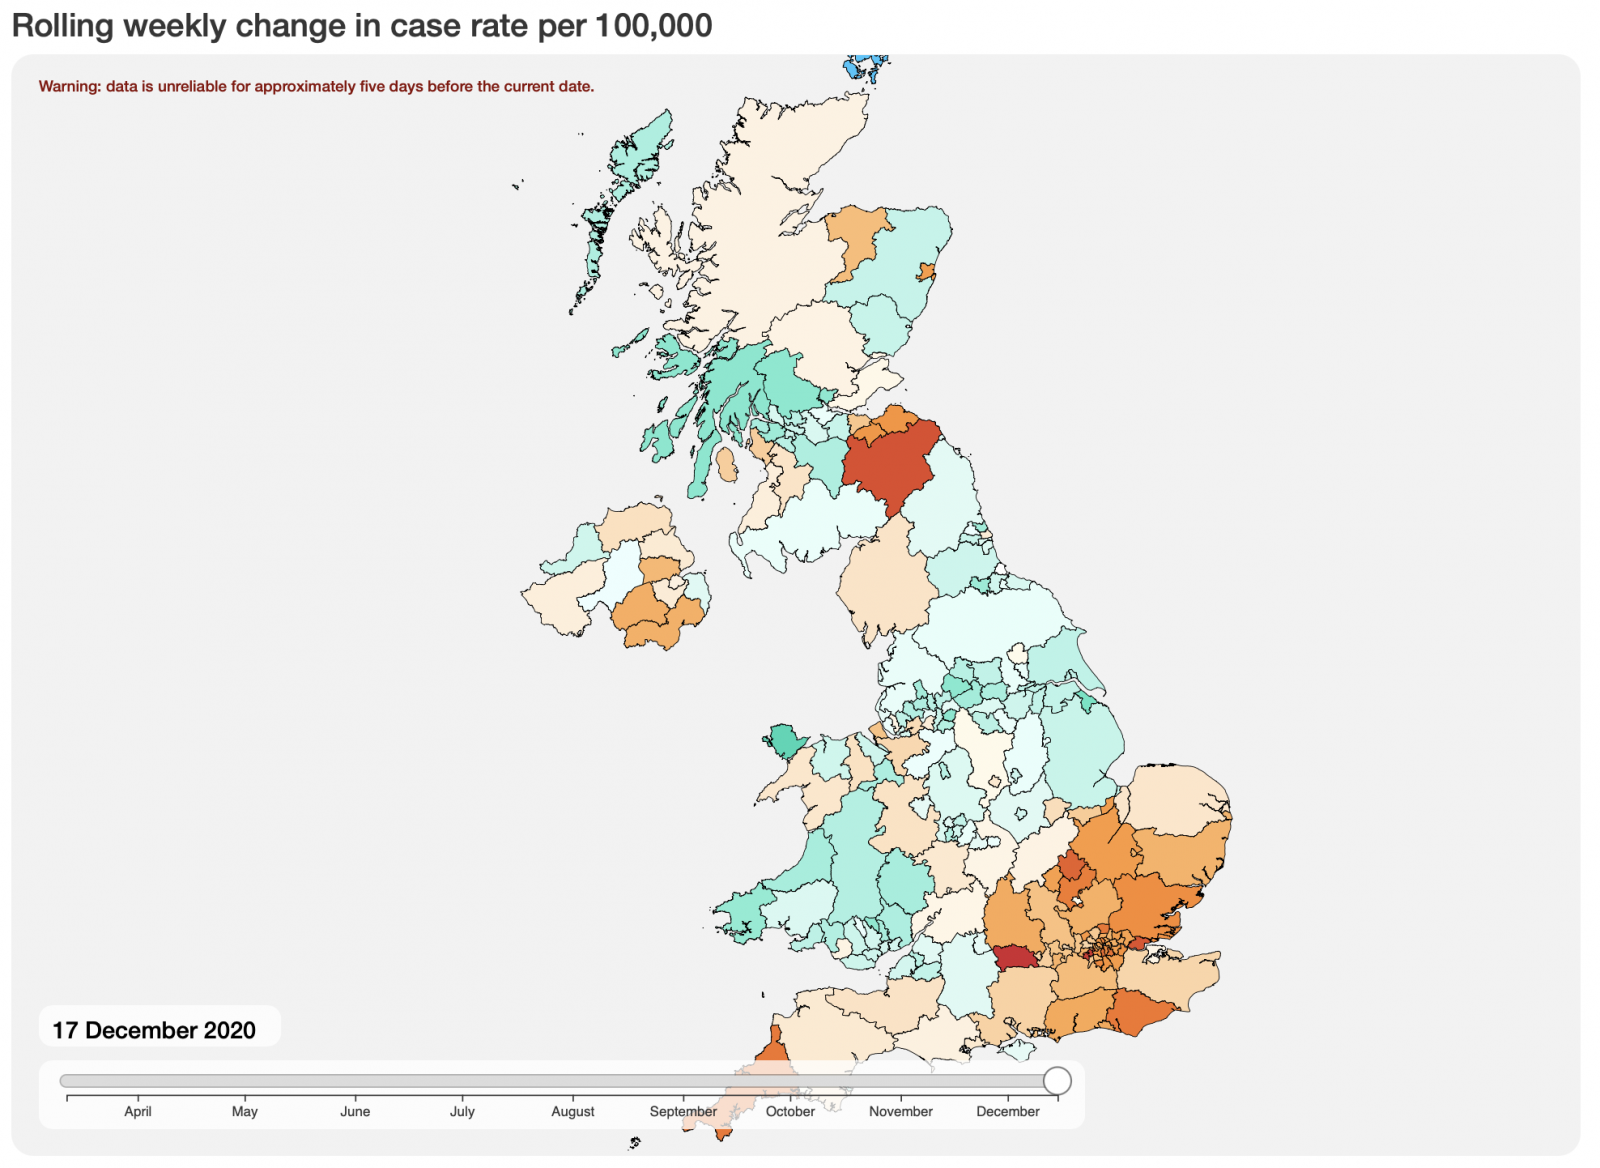
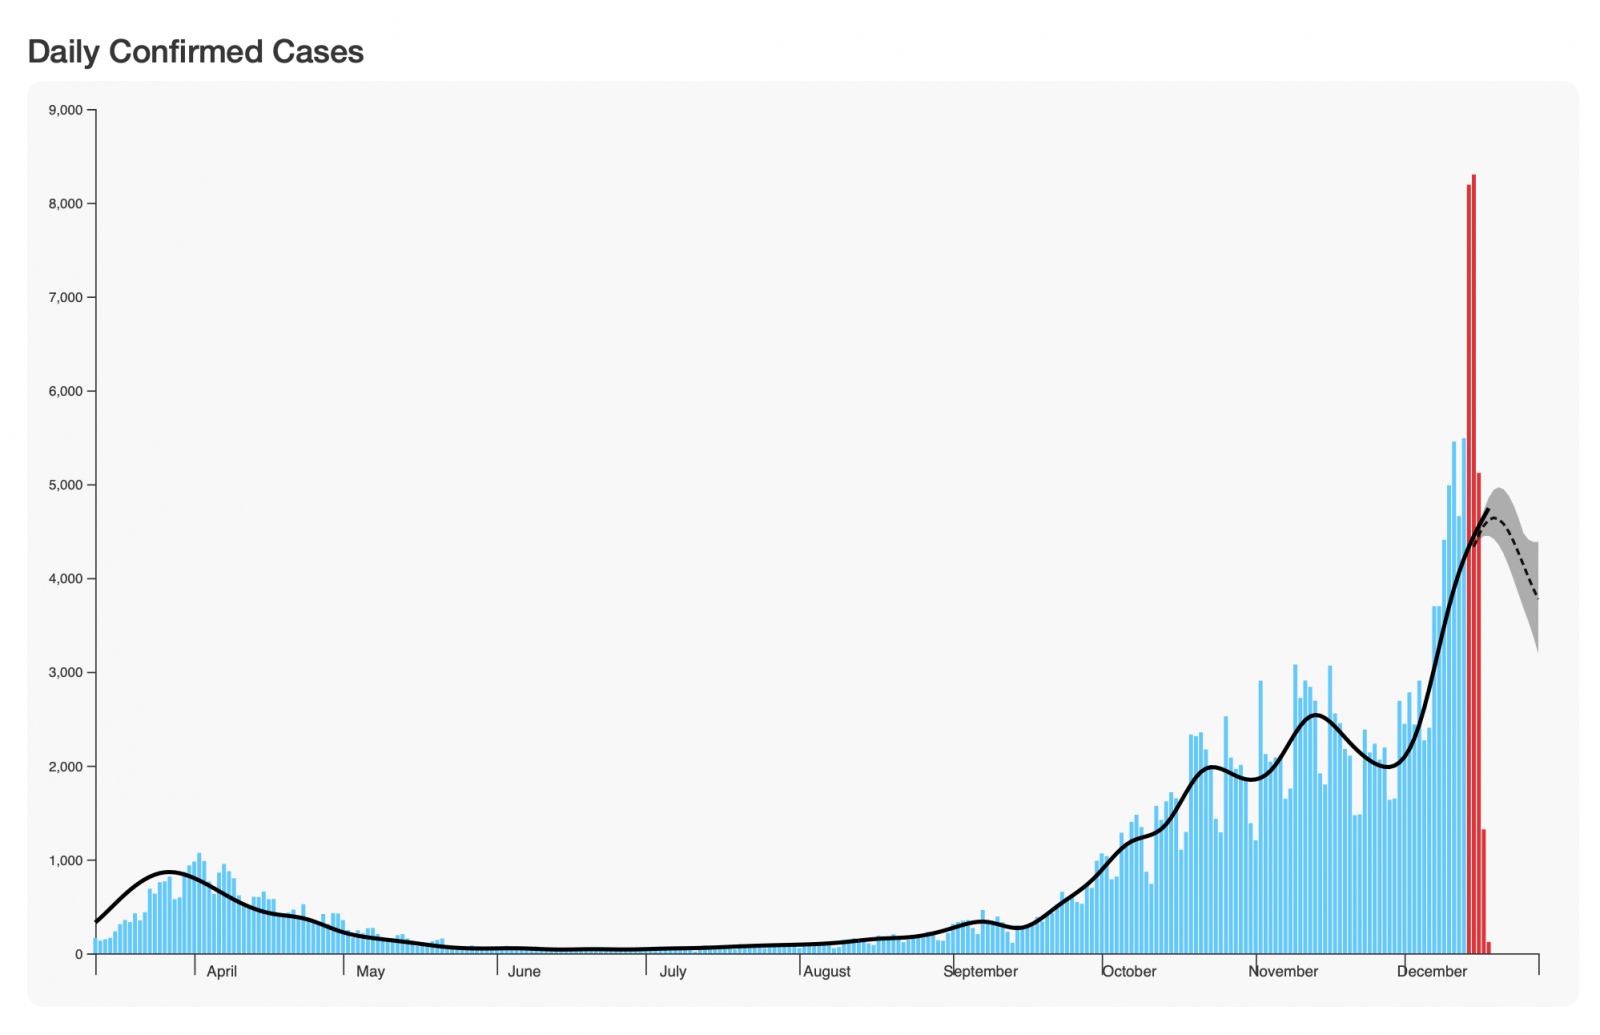
Some parts of the UK are seeing increasing daily case numbers (first image) and a continuing increase in the rolling live case rate (the second image shows weekly case rate calculated per 100,000 population). 1
It’s been obvious for months that public policy response has been inappropriate, ineffective and, to a large extent, ignores early data and the underlying science. Having now discussed the matter with our epidemiology team (or rather, being beaten to the phone by them calling to have a good rant), here are some basics, none of which will be remotely a surprise:
- A new strain of the virus (VUI – 202012/01) has not suddenly emerged from ‘nowhere’: strains in the UK, as everywhere else, have been emerging for months, with mutation happening all the time;
- Most mutations make little or no difference. Basic evolutionary biology however dictates that mutations in established (ie pandemic) viruses are selected for when they increase transmissibility and reduce lethality. That’s not to trivialise Covid-19 in any way: relatively fewer people dying from a larger infected population actually puts a greater strain on medical resources;
- However, there is a suggestion in the source paper by the COG Consortium2 that the range of mutations now being seen may be related to the use of convalescent plasma and remdesivir in patients;
- So the ‘new’ strain of the virus was neither unanticipated nor more deadly, both of which have been claimed by Johnson, Hancock et al. What it does mean is that recommendations such as the 2m social distancing rule are now less effective – it needs to be greater than that, something we’ve known from the way the virus has been evolving (checks notes) for at least four months;
- Our own projections (which are inherently weighted by the impact of earlier, more severe, restrictions during the pandemic), have consistently shown for weeks that a full lockdown would have turned the corner in case rates, had such been introduced any time in the last several months – this image shows projection from 14 December for London, on that basis3;
- As ever, the root of the problem is the series of partial and somewhat arbitrary lockdowns enacted in that period: there has been no attempt to ‘overkill’ the pandemic through the sort of full and enforced lockdown that has enabled countries such as Taiwan4 to eliminate the virus from circulation.
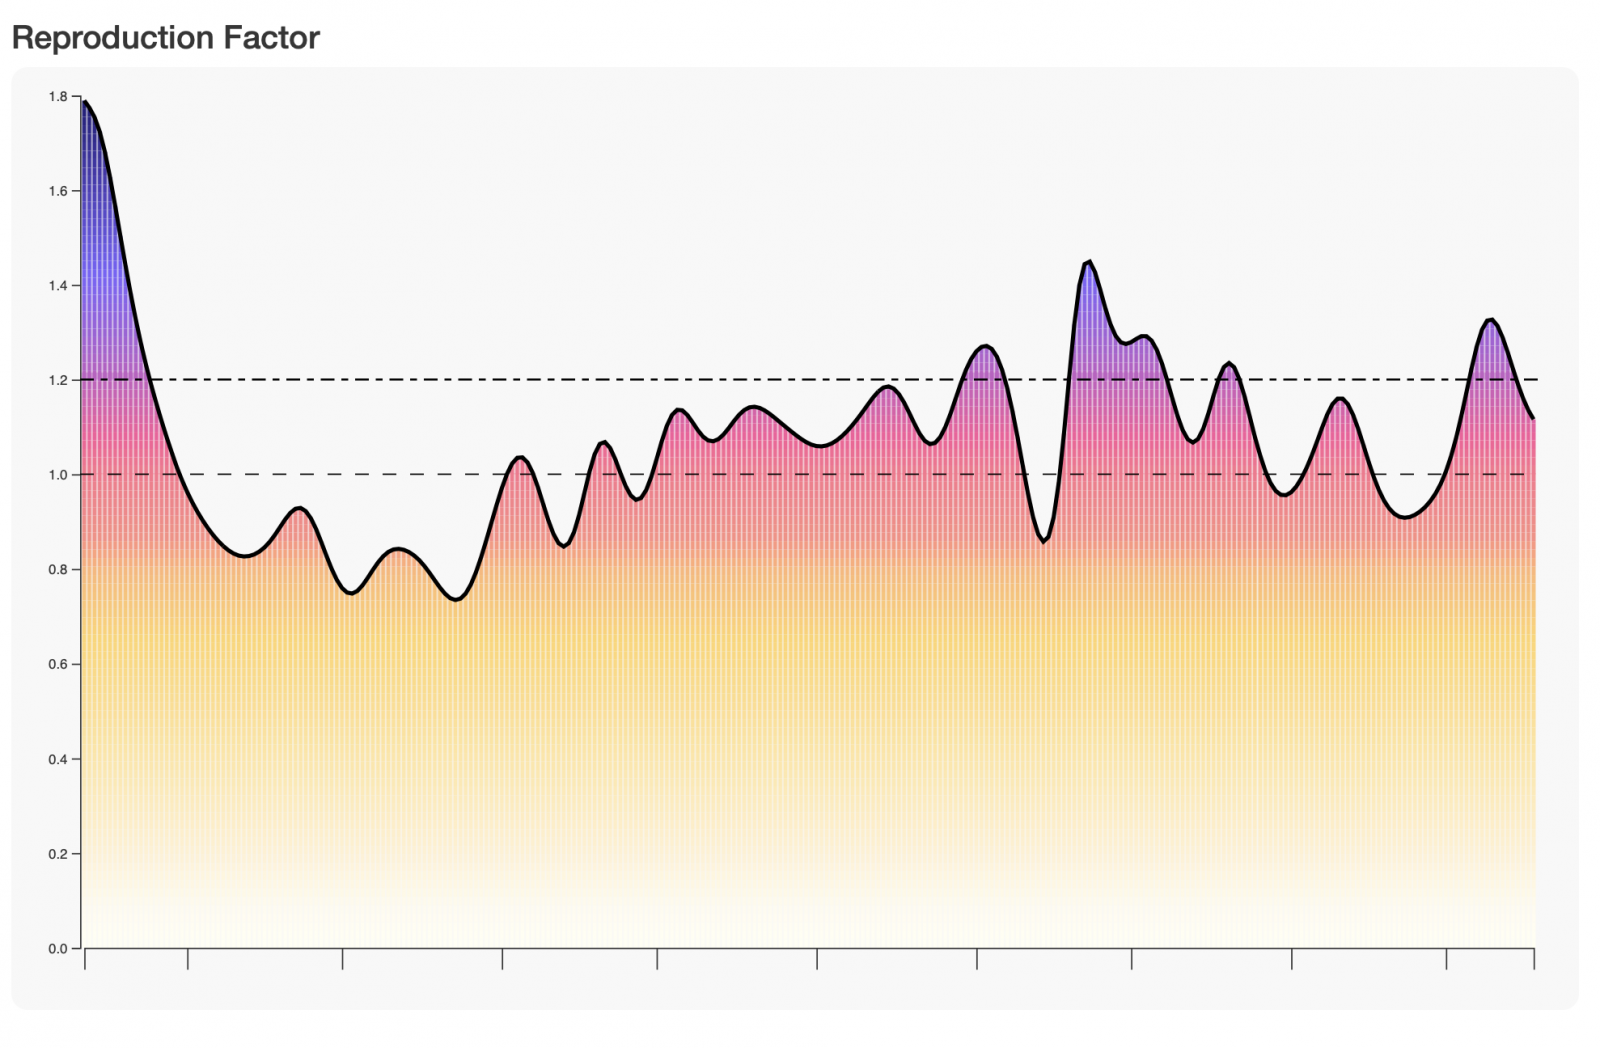
- It’s not as though they weren’t warned: our own daily R number calculations (which use a slightly different methodology to the official figures), show that the R number in London has been above 1 on all but 21 days since the beginning of September and has been consistently above 1.2 since 6 December. That said, our own view is that the R number on its own is a pretty poor predictive indicator of case rates;
- Decision making in public policy appears to have made no serious attempt to adjust to the changing response of the population over the course of the pandemic, and especially to the drive to association around Christmas: ‘pandemic fatigue’ and a determination to enact plans that were made in accordance with the prevailing advice are real factors and should not be ignored in policy decisions, which appear to be made on the basis of what people ‘should’ be doing rather than on what they ARE doing;
- Finally, and importantly, the sudden announcement that the most populated parts of the country were going into Tier 4 (itself a not particularly strict lockdown) from midnight last night has created its own ‘superspreader’ event as large numbers of people dived for the trains and airports to get out of Dodge before the deadline. Again, utterly, utterly predictable.
I’m trying to establish facts here from evidence, so do not intend to go into discussion of the motivation and influences behind the political decisions.
I will however say that, while the devolved administrations have generally done a far better job of communication with their populations, they’re still constrained by the actions of Westminster, by the quality and timeliness of the available data and by the tools available to them and to their data science teams.
Edited for typos and reference to the COG-UK paper.
Development of Two Worlds’ analytic platform for the Covid-19 pandemic is supported by InnovateUK under R&D grant 54368.
Footnotes:
- Both are calculated here to 15 December, due to the unreliability of published data for several days after publication.
- Preliminary genomic characterisation of an emergent SARS-CoV-2 lineage in the UK defined by a novel set of spike mutations
- Our model uses the entire time series of pandemic data to generate projections for two weeks ahead, from four days behind present, the latter simply because it takes several days for the recorded data to settle down to being pretty much as good as they’re going to get.
- Taiwan has not been through a chaotic cycle of lockdown and relaxation: they actually used the data to determine that, once the initial infection was contained, the only way to prevent recurrence was if at least 75% of the population wore masks outdoors at all times AND washed their hands with great frequency. That, along with strict controls on cross-border travel, have minimised the impact on both daily life and the overall economy. [Source: Webinar with Taiwan’s Digital Minister on 8 December].

