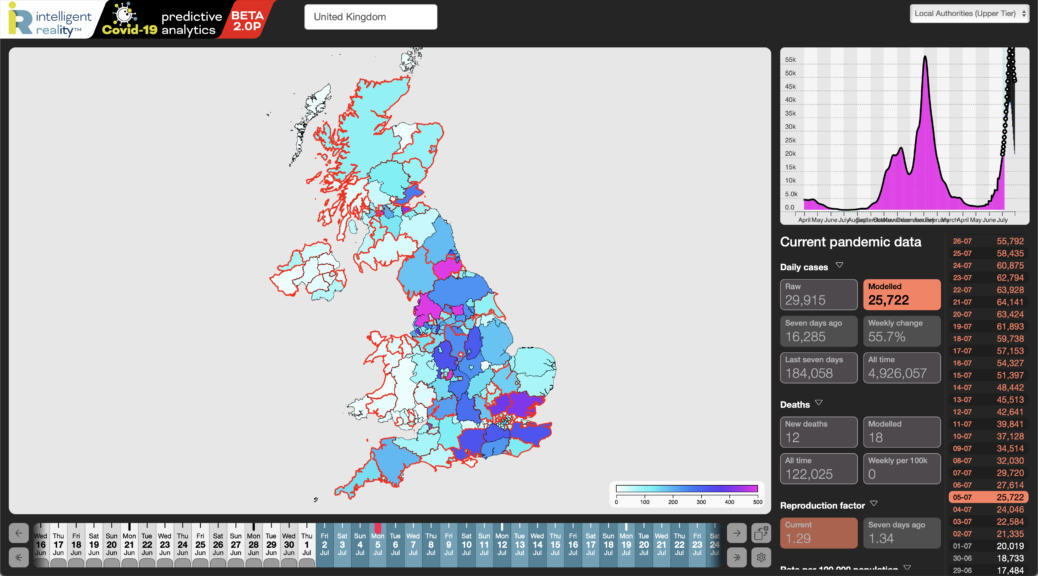
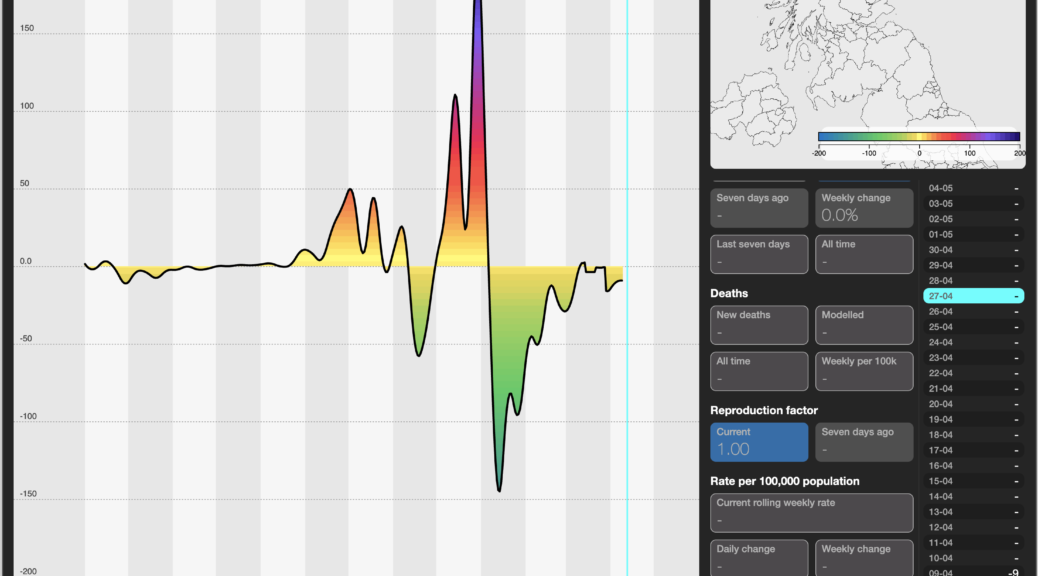
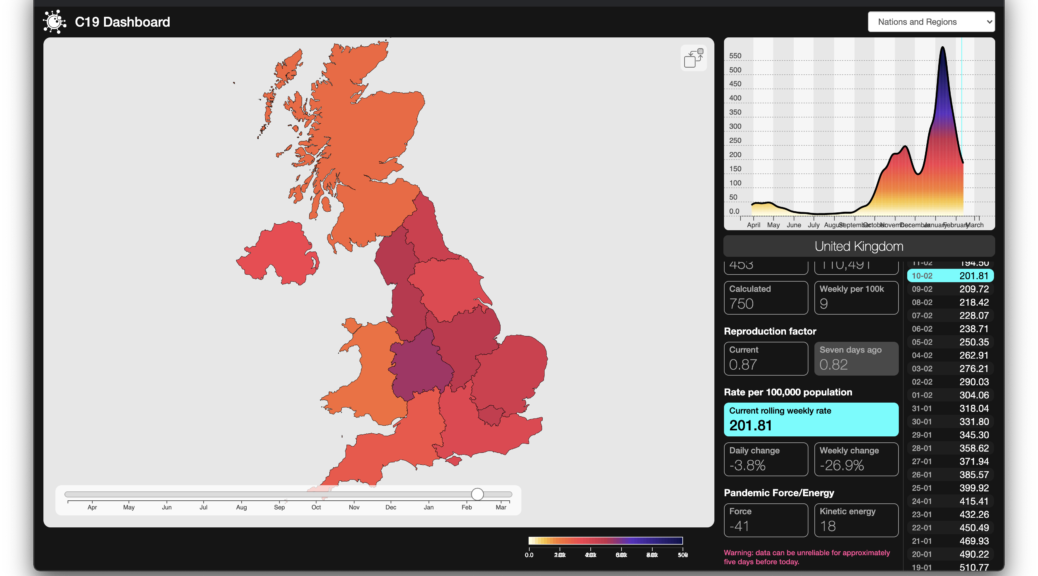
The UK’s ‘Prime Minister’ stood up in Parliament today and stated that “Provided the current encouraging trends in the data continue“, Covid-19 restrictions in England would be lifted by the end of the month. At Intelligent Reality, we’re not entirely sure to which data he refers – possibly those from his home dimension? In looking at the published official data, we’re coming to rather different conclusions.
Tag Archives: prediction
Never Argue with an AI
I owe our system an apology. After it started forecasting a downturn in Covid-19 cases for Scotland, I was dubious, suggesting that because it didn’t ‘know’ about the combination of the final Euro2020 matches or the relaxing of restrictions at a time of rising case numbers, it was being overly optimistic. I was wrong. I owe it the computational equivalent of a beer or two.
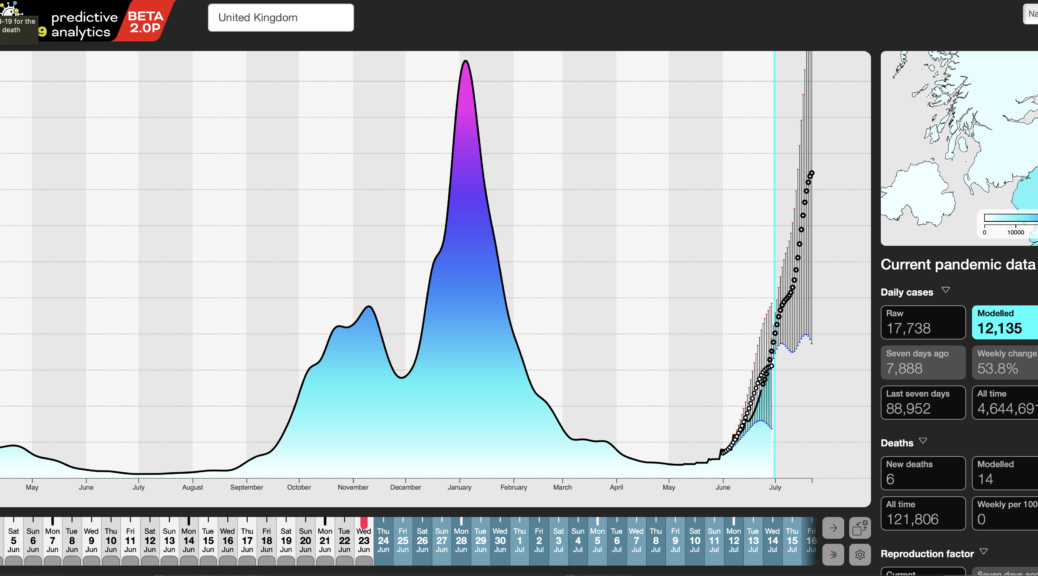
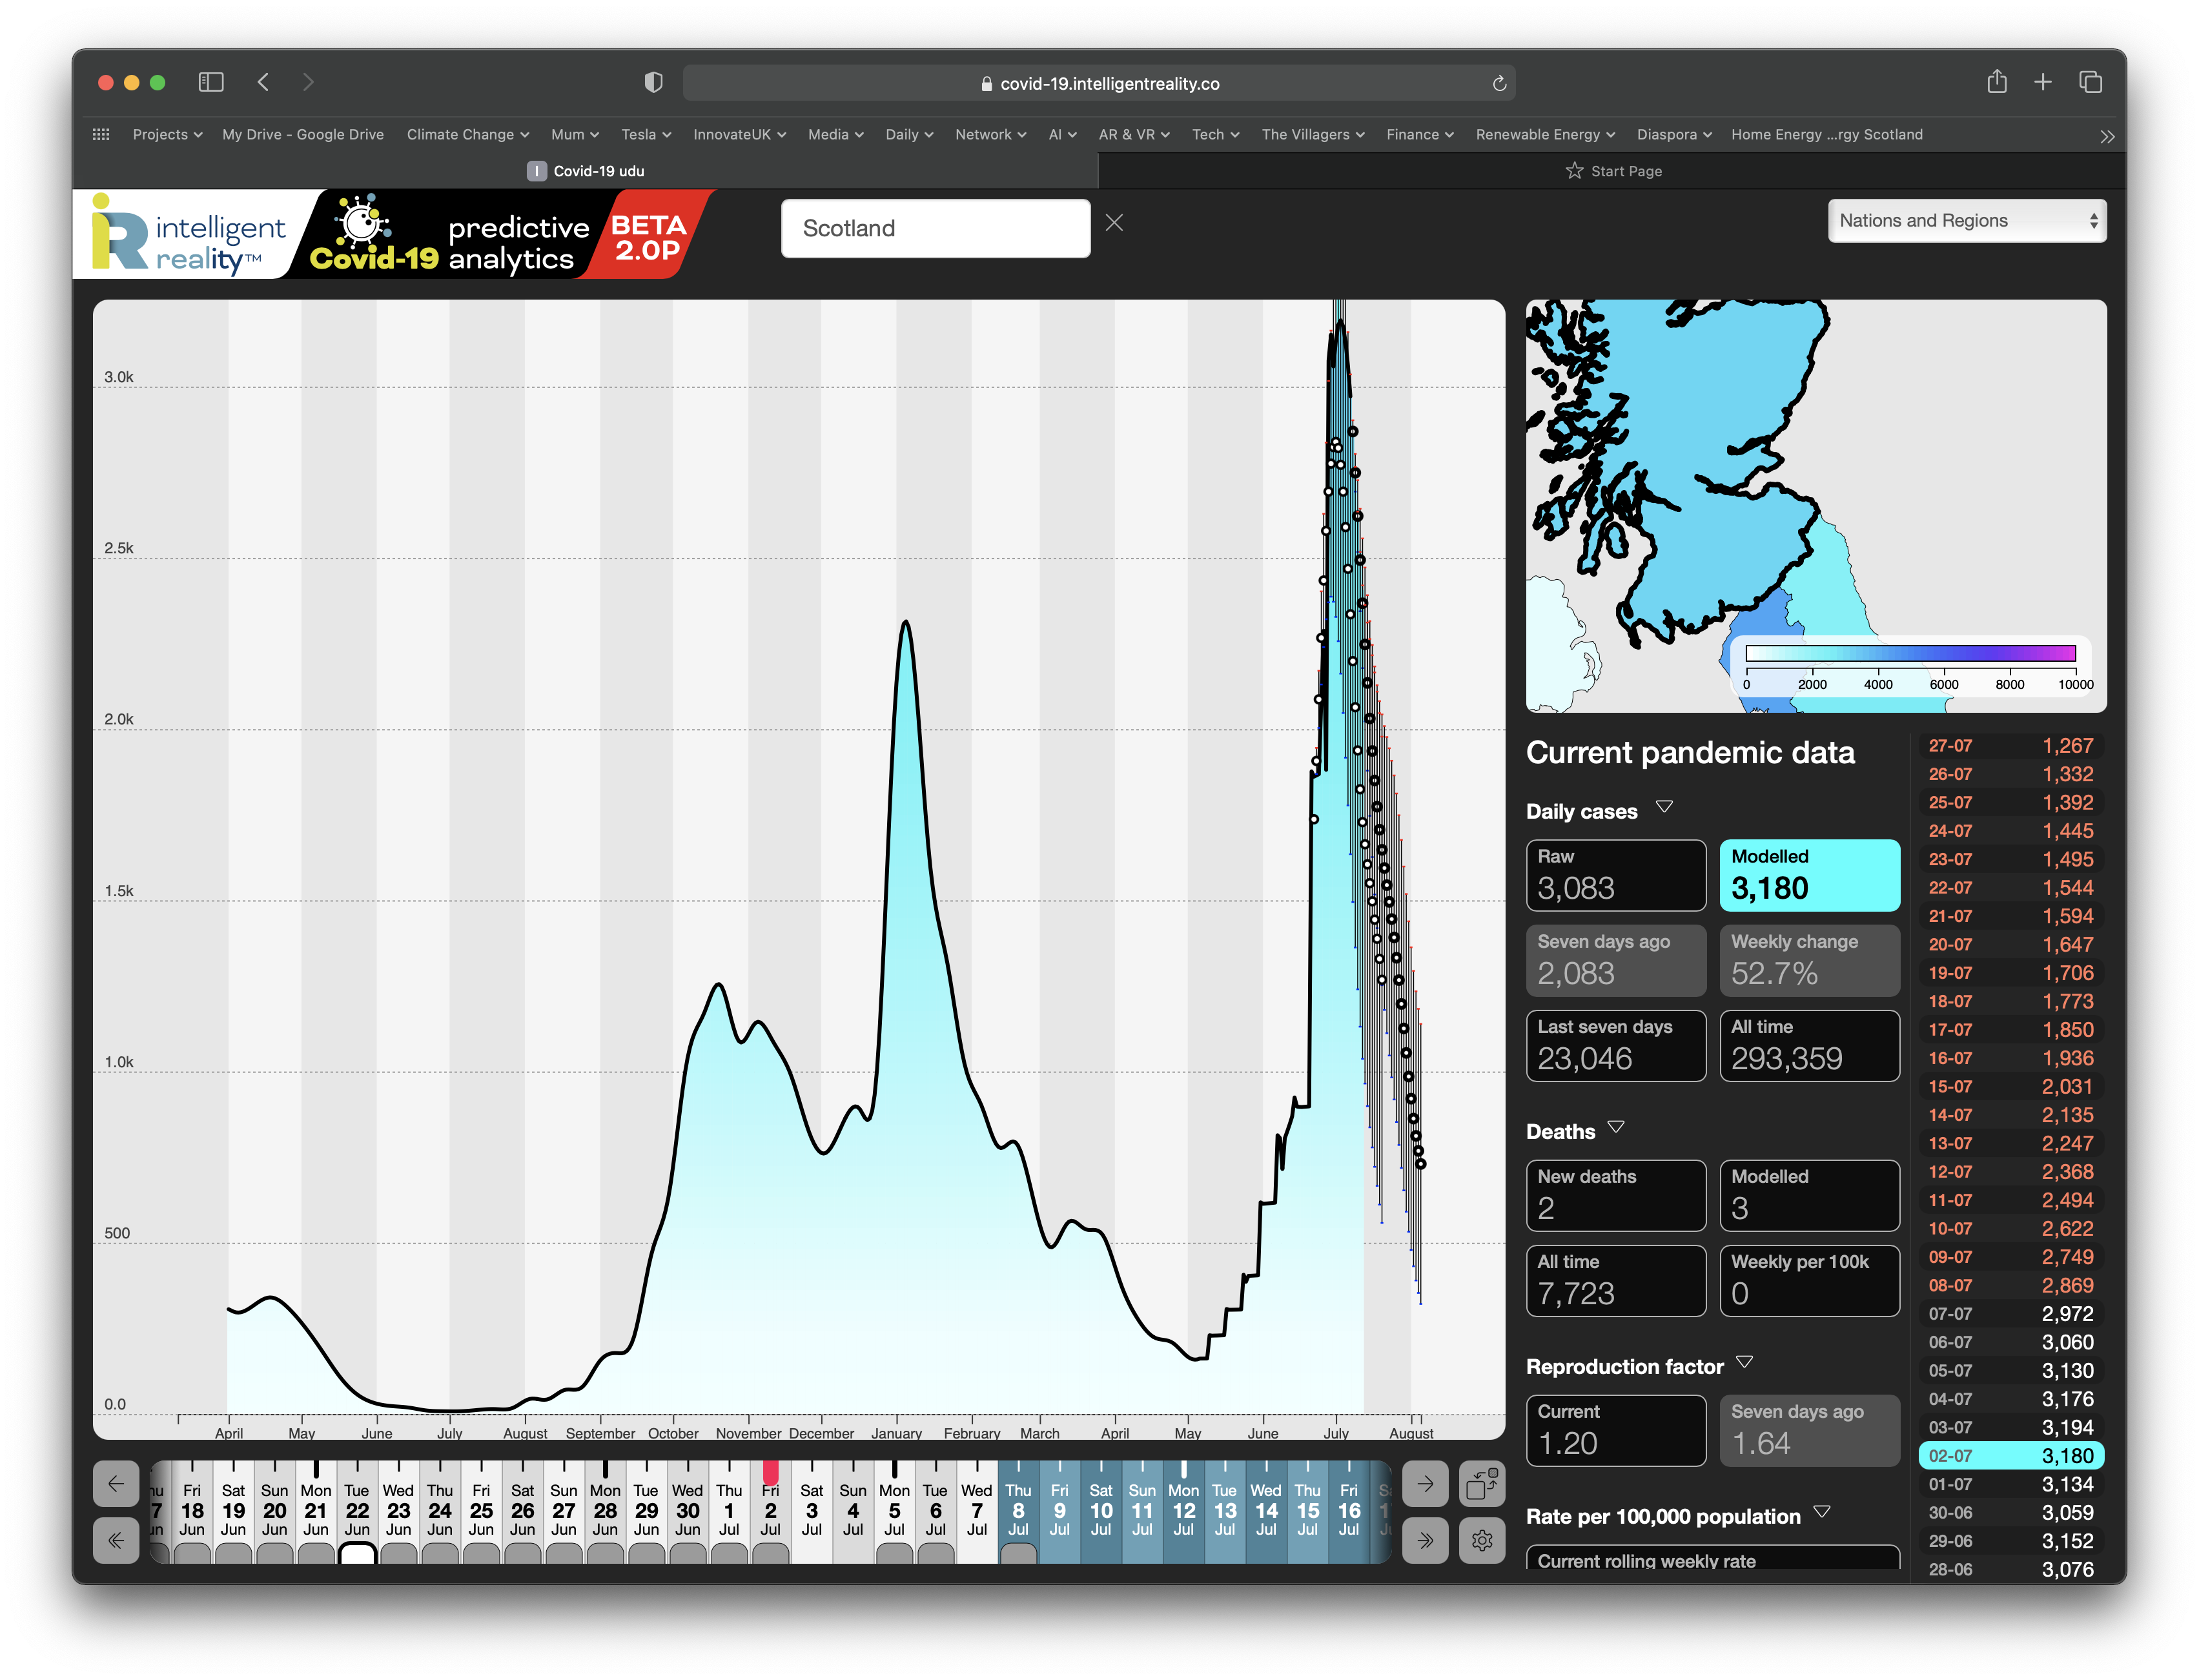
From about 17 June, it was forecasting a peak in case numbers for Scotland on or around 5 July, even if it was short on actual case numbers. Since 22 June though, it’s been spot on in both curve and case numbers. The image is of our case number model, plus our current forecast, overlaid with our forecast from 22 June. Basically, it nailed it. The lesson is not to argue with a system that uses more variables than I can count without taking my socks off.
Third Wave Rising
We’ve already shown that our forecasting system has been effective in providing advance warning of the current Third (or Fourth, depending on how you’re counting) wave of Covid-19 cases. With that wave now fully established, we’re looking again at our forecasts, the core data and our dynamic analyses of the pandemic, especially given the latest UK government policy.
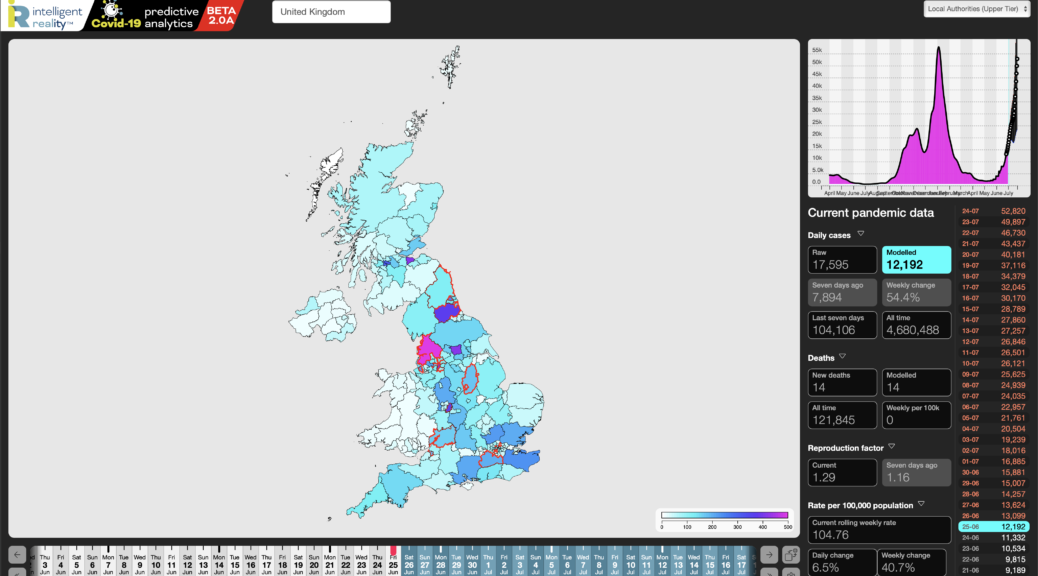
With the UK’s rolling weekly case rate now at 238/100k population, up 60% on a week ago, and 40% of the way to the January national peak, we are not reassured. Looking at the behaviour of Chris Whitty’s eyebrows during government briefings, we suspect that neither is he. The current wave is so far unevenly distributed, with urban centres showing the biggest rises, in many cases well above the January peak with, as previously noted, an apparent strong association with those areas most engaged in the Euro 2020 competition. Given little restriction on movement, we believe that these centres of infection are in the process of seeding a ripple of infection across the rest of the country. Continue reading Third Wave Rising
The Impact of G7 and Euro 2020
We’ve now moved from forecast to reality: the UK (and others) are in the throes of a new wave of infections, driven by the Delta variant of the Covid-19 virus. In the UK this has almost certainly been facilitated by both the general relaxation in lockdown and by events such as the G7 Summit and the Euro 2020 competition.
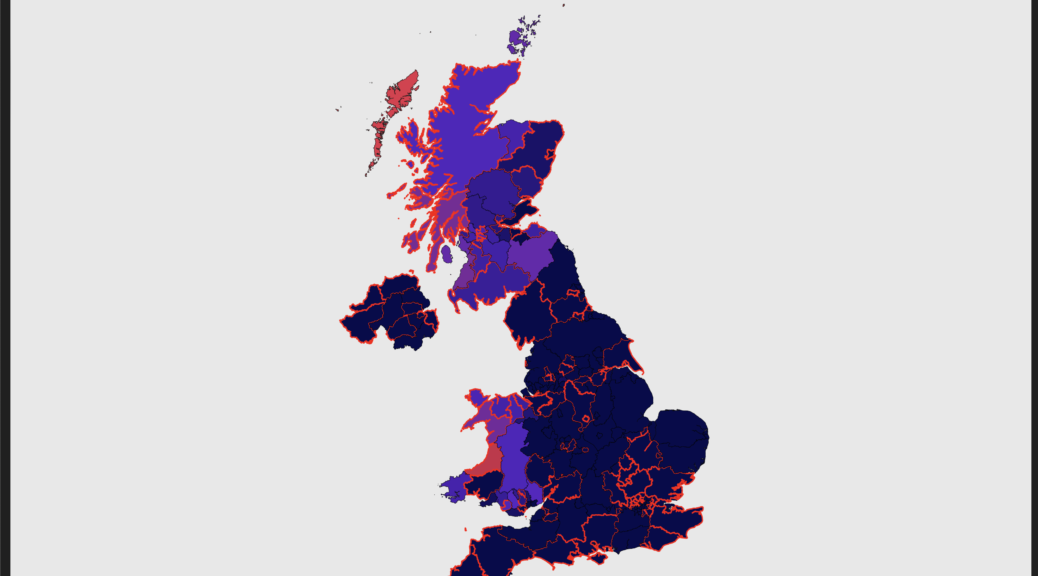
We have now introduced an alert system, which looks for outliers against the current trend in case numbers and pandemic force – this shows that cases and pandemic force spiked in Cornwall following G7 and, as of now, Glasgow (Hampden) just misses out on triggering our alert system and Brent (Wembley) and Edinburgh (the other major source of travelling Scotland fans) both now make our alert list (the red outlined local authorities in the header image). Continue reading The Impact of G7 and Euro 2020
How accurate are our forecasts?
Taking the current rise in infections as an example, our analytic system has, consistently been able to forecast changes in the Covid-19 pandemic across the UK – we started with 14-day forecasts and have now pushed those out to 28 days. We made that change as we improved our algorithms, validated our earlier forecasts and, of course, as our system has had more historical data to work with, it’s got somewhat better at its job.
To validate the forecasts, we measure their daily predictions against what subsequently transpired – these can be displayed in our dashboard by clicking the grey tabs below each date in the horizontal date picker at the bottom.
For that period then, we have forty four 28-day hindcasts, plus the current forecast, from 24 June (today being the 30th – the lag is down to the rolling evolution of data quality for recent days).
For the UK, on thirty six of those forty four days, our forecasts generated a trajectory that closely matches the subsequently recorded change in case numbers, by which we mean effectively tracked the actual case numbers for at least two weeks into the 28-day forecast. We call those Actionable forecasts, in that they’ve proven accurate enough to confidently have taken policy decisions against.
Our header image shows the current forecast for the UK, overlaid with our hindcast for our forecast from 1 June. We think that speaks for itself.
Conscious Uncoupling
As of 11 May, our Covid-19 forecasting system started consistently predicting a coming rise in cases for the UK, driven largely (as it turns out) by the Delta variant of the Covid-19 virus. In the UK this has almost certainly been facilitated by both the general relaxation in lockdown and by events such as the G7 Summit and the Euro 2020 competition. So far, so bad.
Other factors though are far more hopeful – we are seeing a very significant decoupling between case rates, hospital and ICU admissions and in particular death rates. This does demonstrate that the game has changed, and that we need to be rethinking our approach to managing our way out of the pandemic.
That said, government policy in many places still appears to be conditioned by the assumption that the vaccines effectively eliminate transmission, something that simply has not been demonstrated. Continue reading Conscious Uncoupling
The Last Unknown?
A remaining big unknown in the pandemic is not whether vaccines reduce serious symptoms, hospital admissions and deaths – they do – but whether and to what degree vaccines reduce the ability of those vaccinated to infect others, whilst not being symptomatic themselves. As we’ve noted before, initial data on post-vaccination infectivity was somewhat contradictory, so we don’t yet build the impact of vaccination on infectivity into our forecasting.
Late to the Party. Again.
SAGE announced today that England’s R number has risen across to between 0.8 and 1. They update their pronouncements once a week, based on their modelling from data that’s even further behind.
We take a different approach: we use emergent and inferential analysis to generate R number calculations and 28-day forecasts, on a daily basis, for every local authority in the UK.
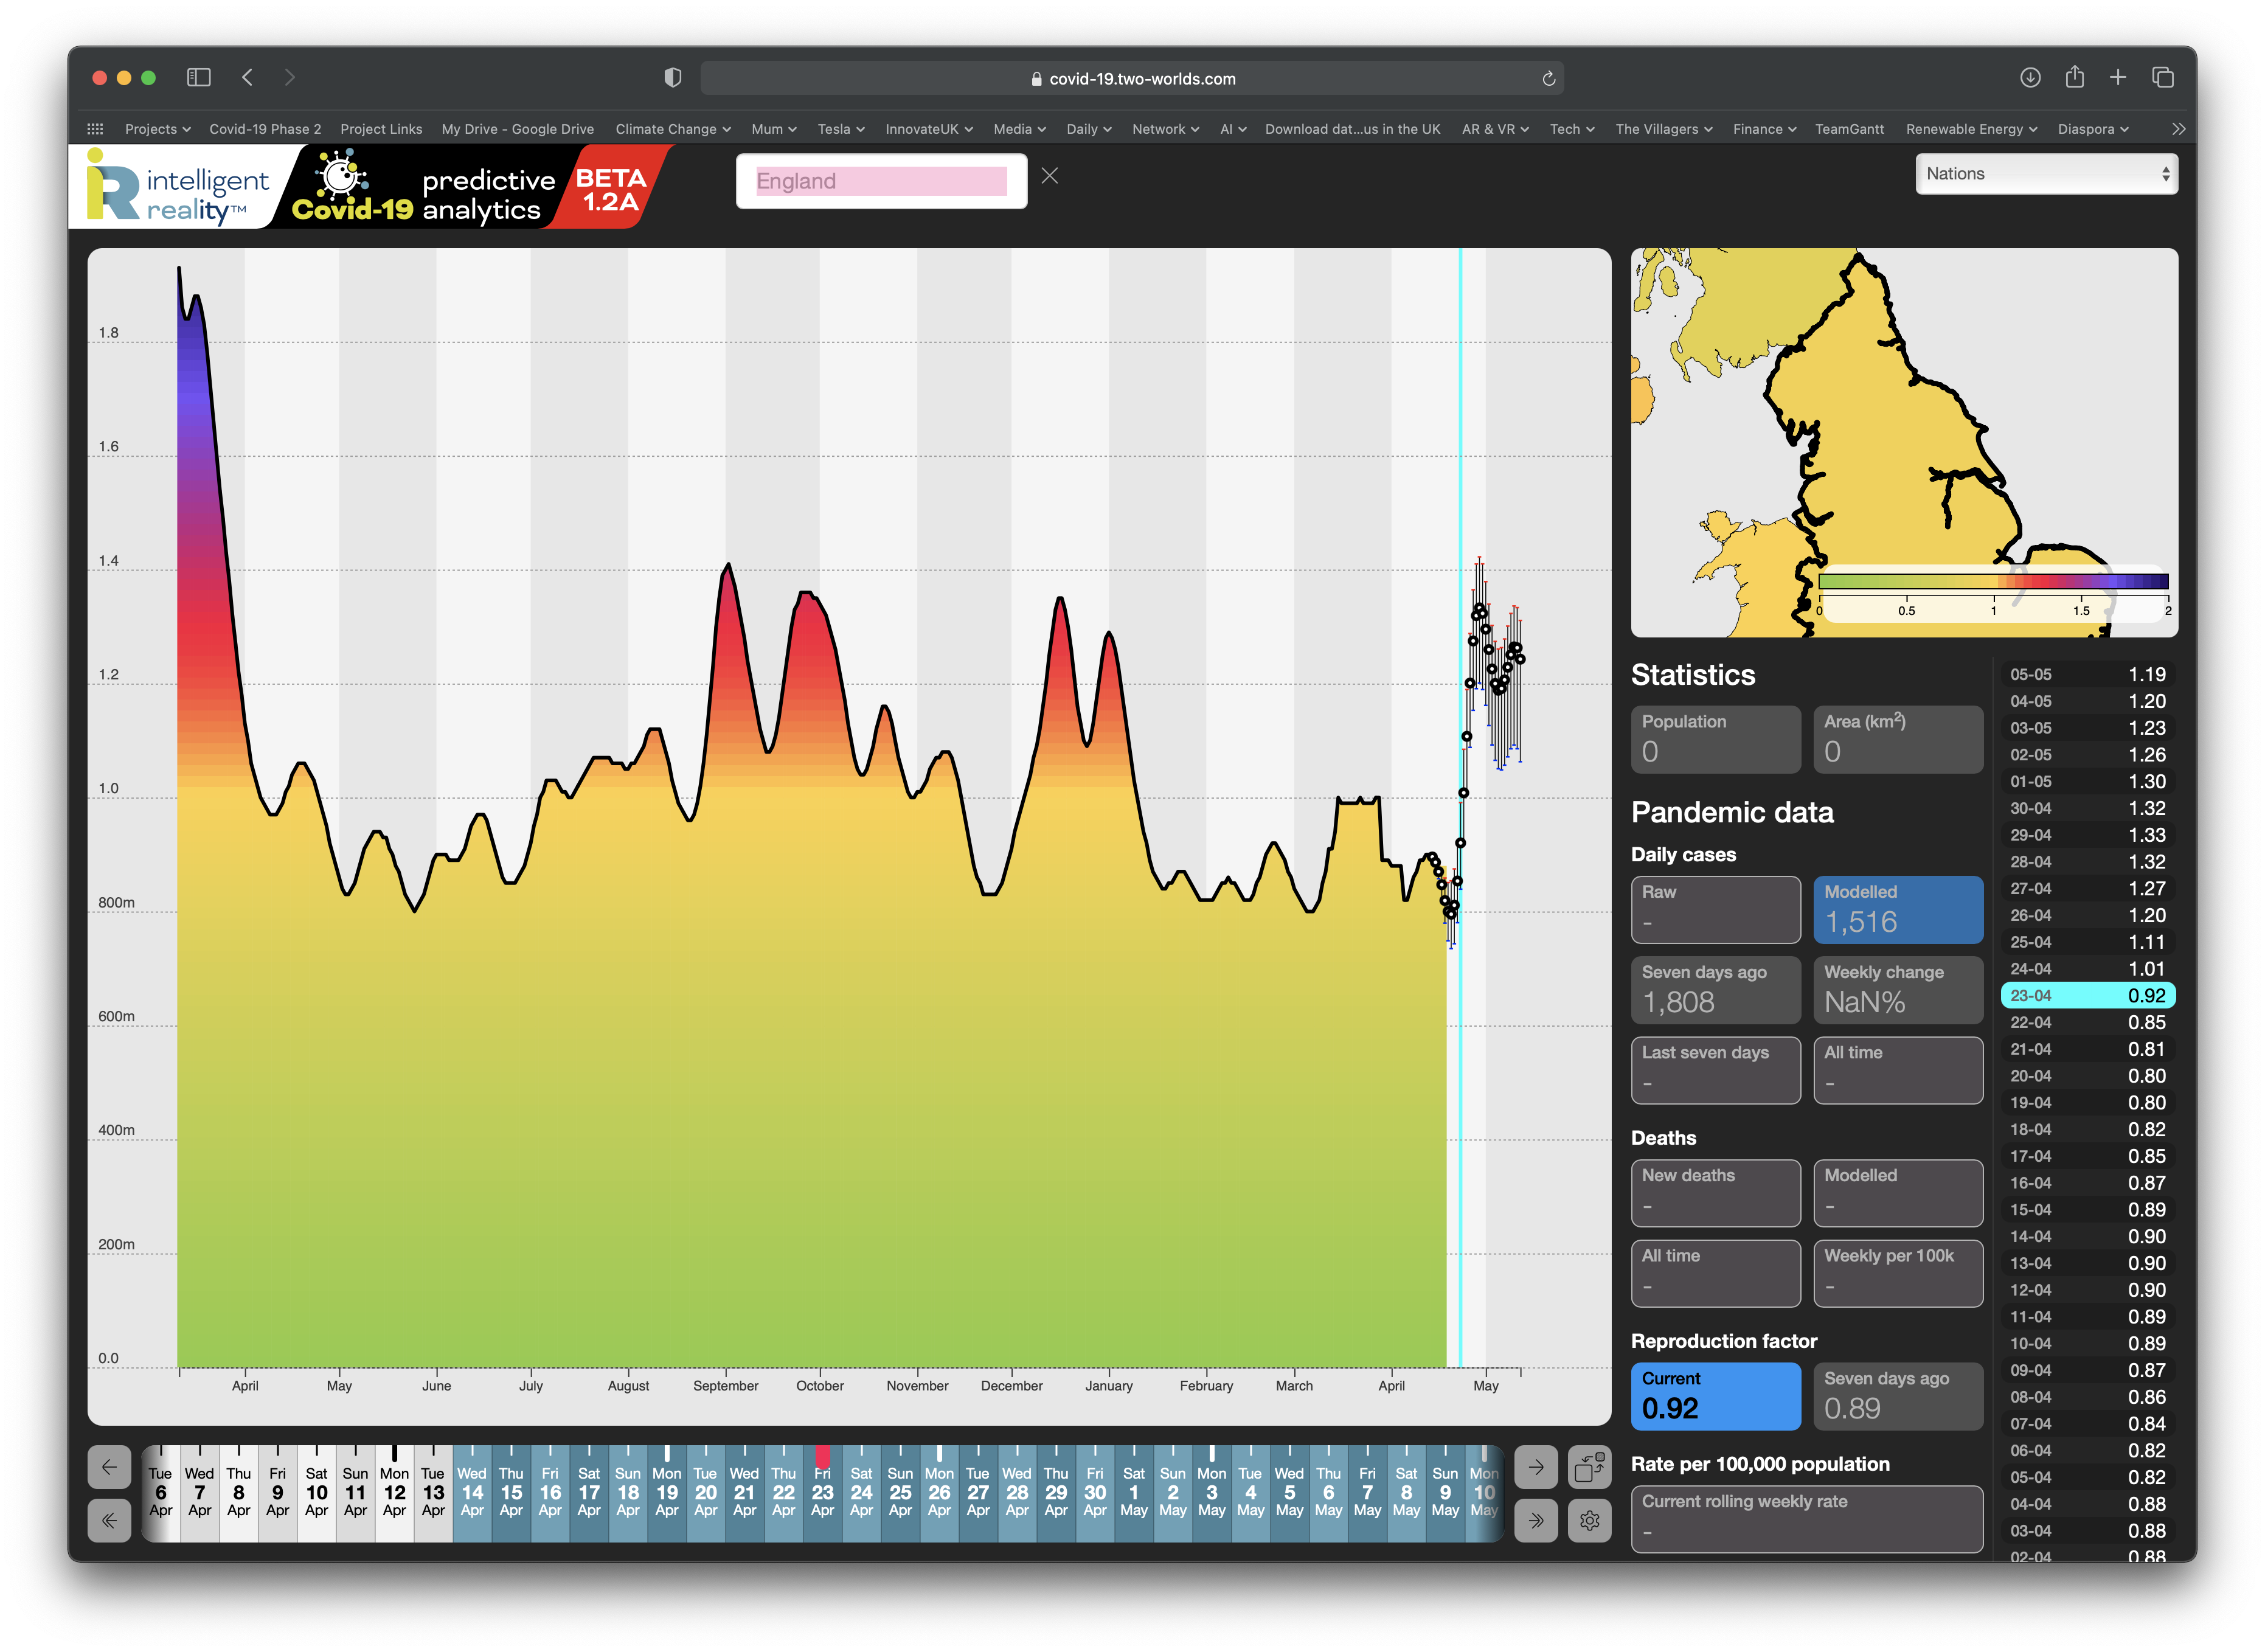
We can say that England, as of today, is at an R number of around 0.92, up from a low of 0.80 on 19 April. Our forecasting suggests that it’s going to go over 1.0 from tomorrow, reaching roughly 1.3 by the end of the month, with England leading the way, followed by Wales and Northern Ireland, with Scotland doing rather better, for the moment at least.
Raining on the Parade?
The time to relax lockdown is once you have a combination of low case numbers (check), an R (infectivity) number that’s well below 1 and trending downwards, and have effectively stamped on any potential hot spots around the country, to the point where the increased travel between areas that we’re already seeing doesn’t risk a spread from those hot spot areas acting as reservoirs of reinfection.
And this does not look like that time. Yes, case numbers are low (rolling weekly rate/100k population across the UK is around 26), but… Continue reading Raining on the Parade?
Proving a Point?
There’s been a lot of covoptimism this past week, from assorted government spokesfolks, including from people who do know what they’re talking about – a prime example being Prof. Neil Ferguson of Imperial. The theme here is that cases, case rates and the R number have been falling strongly and appear to be continuing to do so.
That’s true, to a point. But our modelling suggests that the immediate future is less rosy.
It’s not about the data – we use the same published sources as the government, albeit that they’ve got access to more sources than we do – it’s more about what you do with it.

