The UK government stated yesterday (13 May) that rising case numbers in the Bolton area were a cause for concern, and that very many of these cases were of the so-called ‘Indian’ variant (B.1.617.2 being the designated variant of concern, with B.1.617.1 and B.1.617.3 under investigation). Here, raw data for case numbers has been available for weeks, with organisations such as the Sanger Institute also providing a very informative breakdown by sequenced variants.
Our analytics platform had identified Bolton and other areas as potential concerns more than two weeks ago and had flagged a correlation between these hot spots and the ethnic balance of the local population, such that, even in the absence of cross-border travel data, of the emerging variants or the situation in India, we were able to provide early warning of emerging problems.
Which very much begs the question as to why the UK government only raised this yesterday, and why travel restrictions from India were only imposed long after the pandemic reached critical mass there.
There will be lot of factors that are beyond our ability to influence, but we’ve already beaten to death the subject of delayed decision making based on lagging analyses rather than the sort of near real-time updates that our approach provides.
We however noted, quite early on in our research, that raw case numbers don’t provide a particularly good perceptual understanding of the immediate dynamics of the pandemic for any area – even our system doesn’t show this well in the animation in Figure 1 – this is large part due to our having to calibrate our colour mapping to the highest case load seen during the whole pandemic.
Figure 1: Bolton: animation of modelled (compensated) cases from 2021-04-22 to 2021-05-11.
Forecasts and Kinetics
This is exactly why we developed two early warning elements in our analytic platform: our 28-day forecasting and our Kinetic Modelling, the latter providing a very sensitive view of changes in both the rate of acceleration of the pandemic in an area and of its effective momentum (embodied energy). Individually and collectively these provide key indicators of the direction and potential of the pandemic in any given area.
So, if we take our forecasts for Bolton, we see from that, in its current forecast (Figure 2), our model thinks that – in the absence of serious intervention – case numbers in the area are going to rise dramatically for the near future.
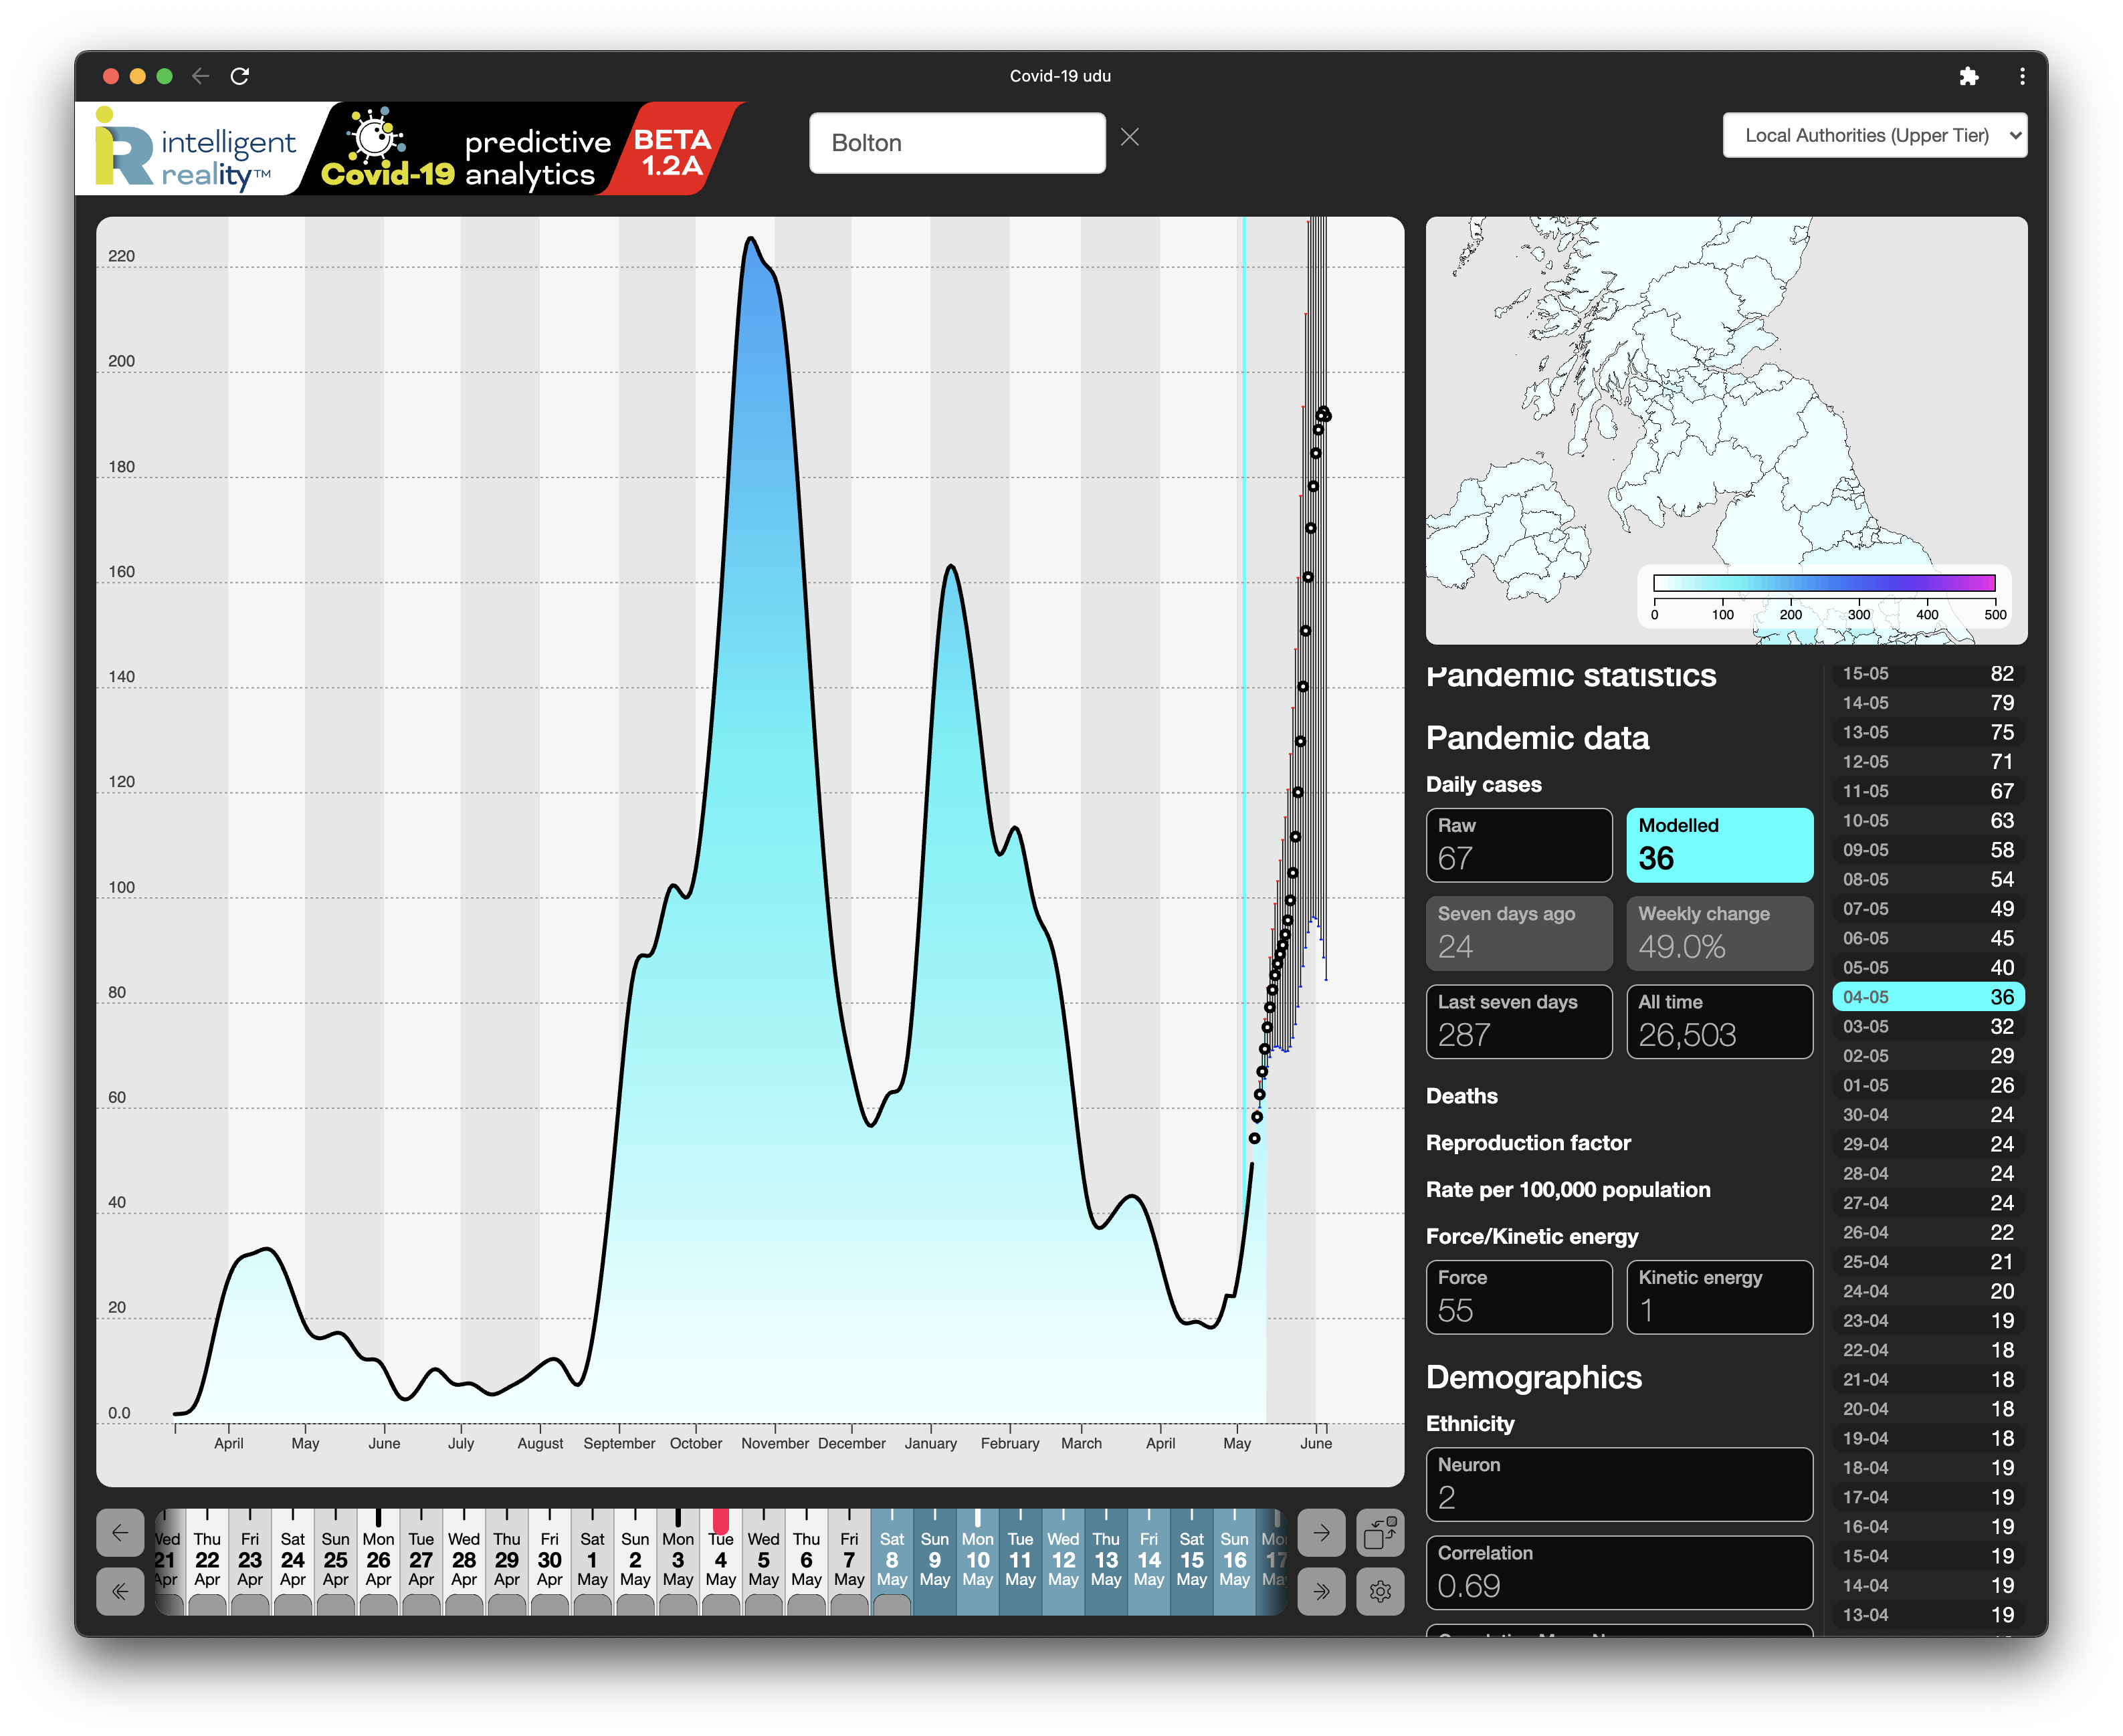
Things get really interesting though if we look at our hindcasts – the the overlay of our past forecasts on what subsequently happened to case numbers. Up to and including the 26th April, our system was of the view that the local rise in case numbers was simply a blip on the established trend of falling case numbers. On 27th April however, it flipped dramatically overnight (Figure 3 animation) to regard it as a significant local increase and an outlier from the wider trends across the country. Any reasonable observer might then regard that as a warning sign, some two-and-a-half weeks ago.
Figure 3: Bolton: animation of case number hindcasts from 2021-04-22 to 2021-05-08
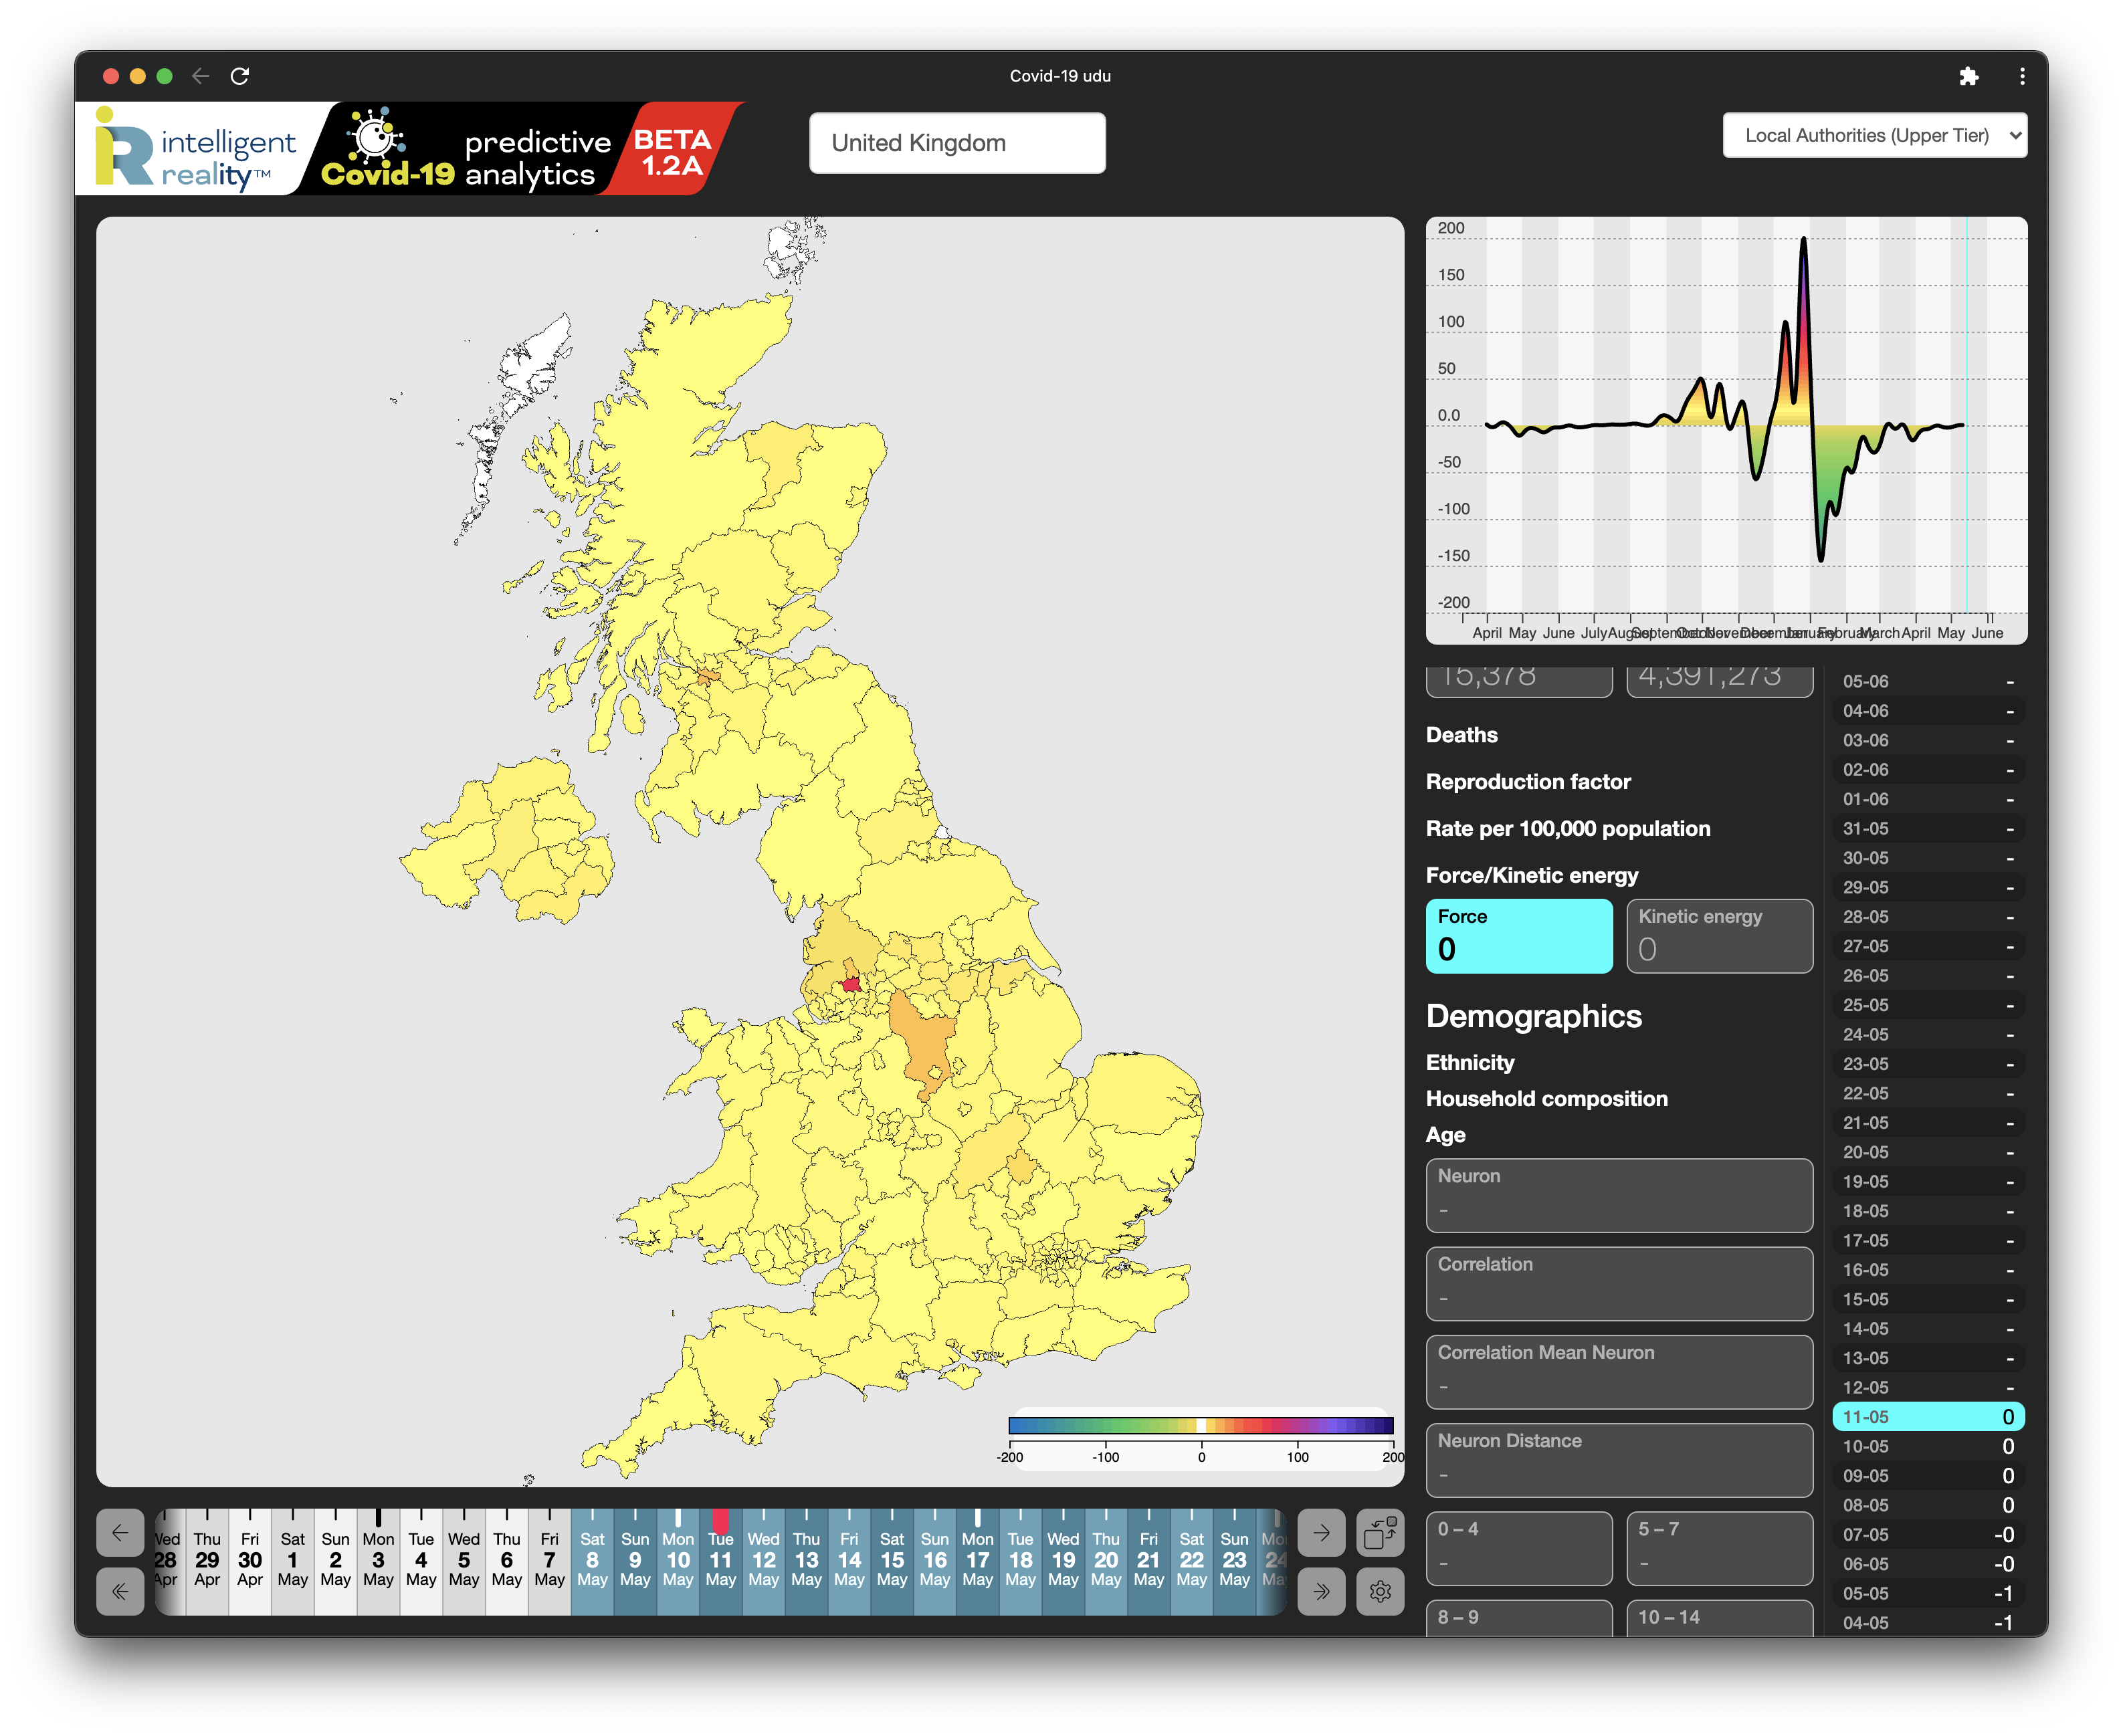
Now look at the kinetics of the pandemic (Figure 4): firstly the local acceleration of the pandemic, which very clearly crossed into acceleration on 21 April and has continued to rise dramatically ever since. In fact, cases in Bolton are accelerating at a rate comparable to what we saw in late December, as B1.1.7 spread across the country. Back then, we were seeing that rise in many parts of the country simultaneously, whereas, for the moment, areas of concern are still outliers against a stable-to-falling national trend, with our overall UK forecast still (for the moment) seeing that continuing (Figure 5). Those areas of concern (Figure 6) are Bolton, Blackburn with Darwen, Glasgow, Derbyshire, Bedford, Northamptonshire and a whole swathe of urbanised areas across South Yorkshire. Moray, which the Scottish Government is maintaining in Level 3 as the rest of the country moves to Level 2, may already have peaked, with Glasgow being by far the main focus of concern here – our system there has been predicting a continuing rise since 5 May.
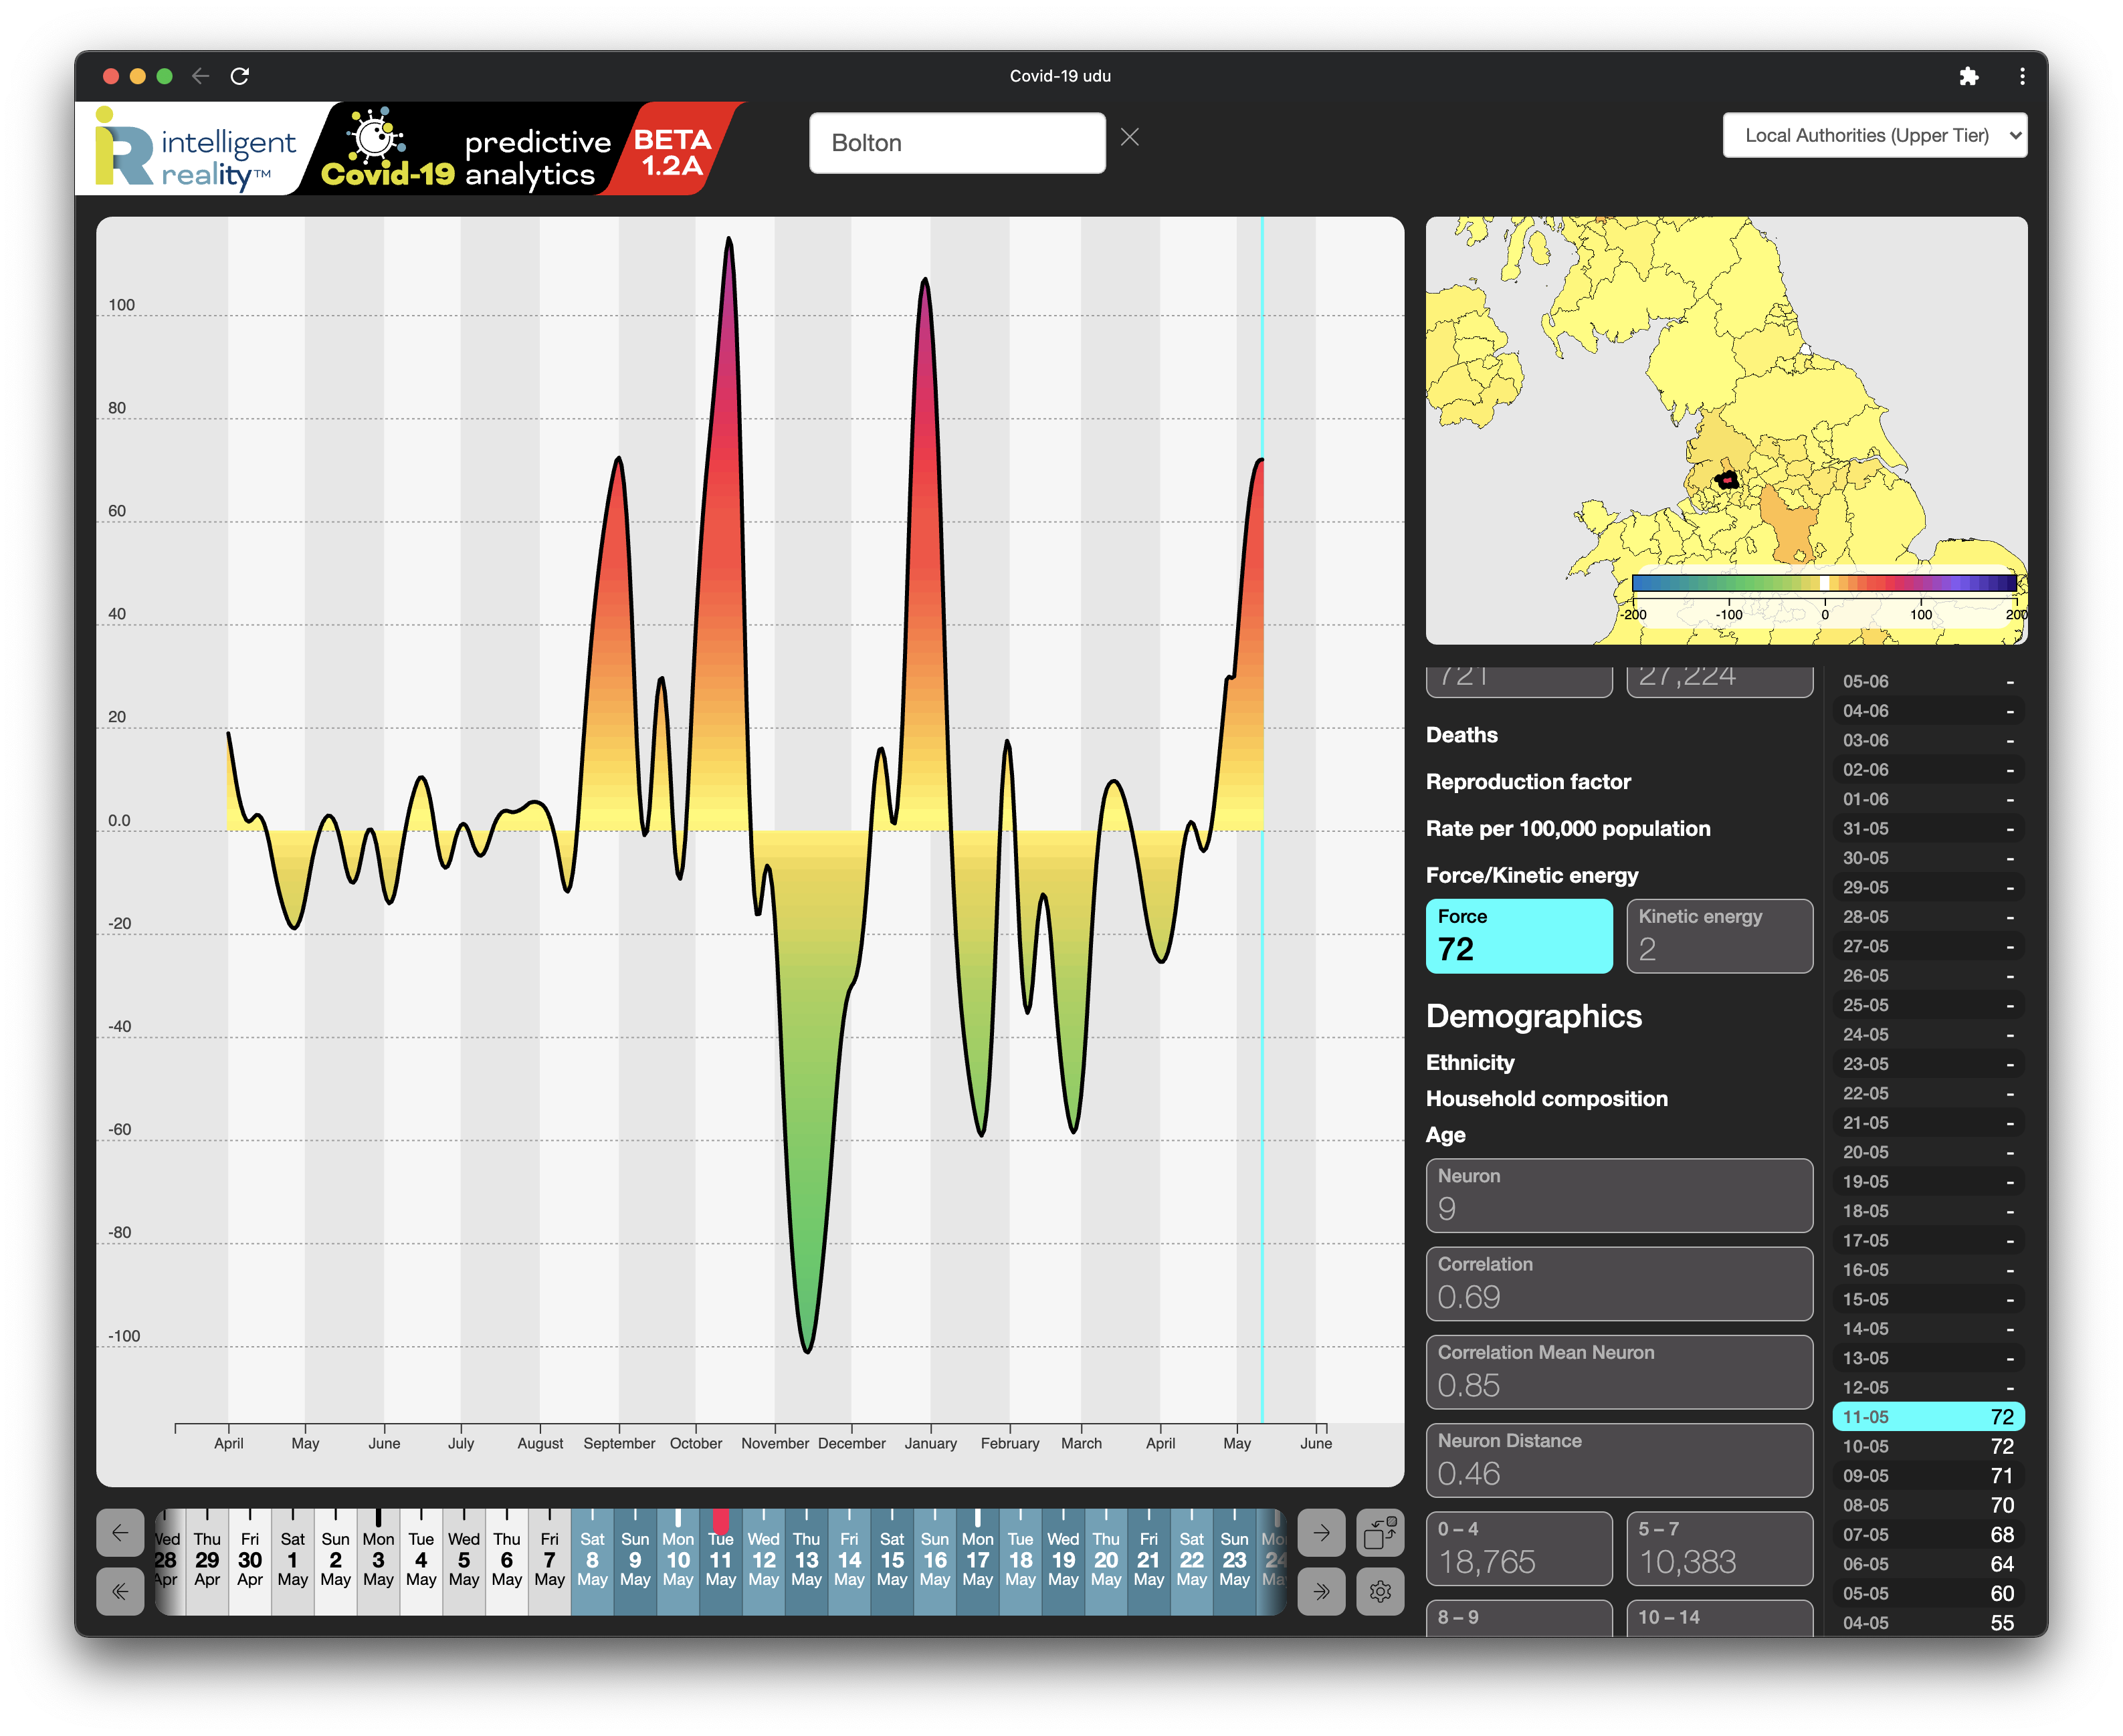
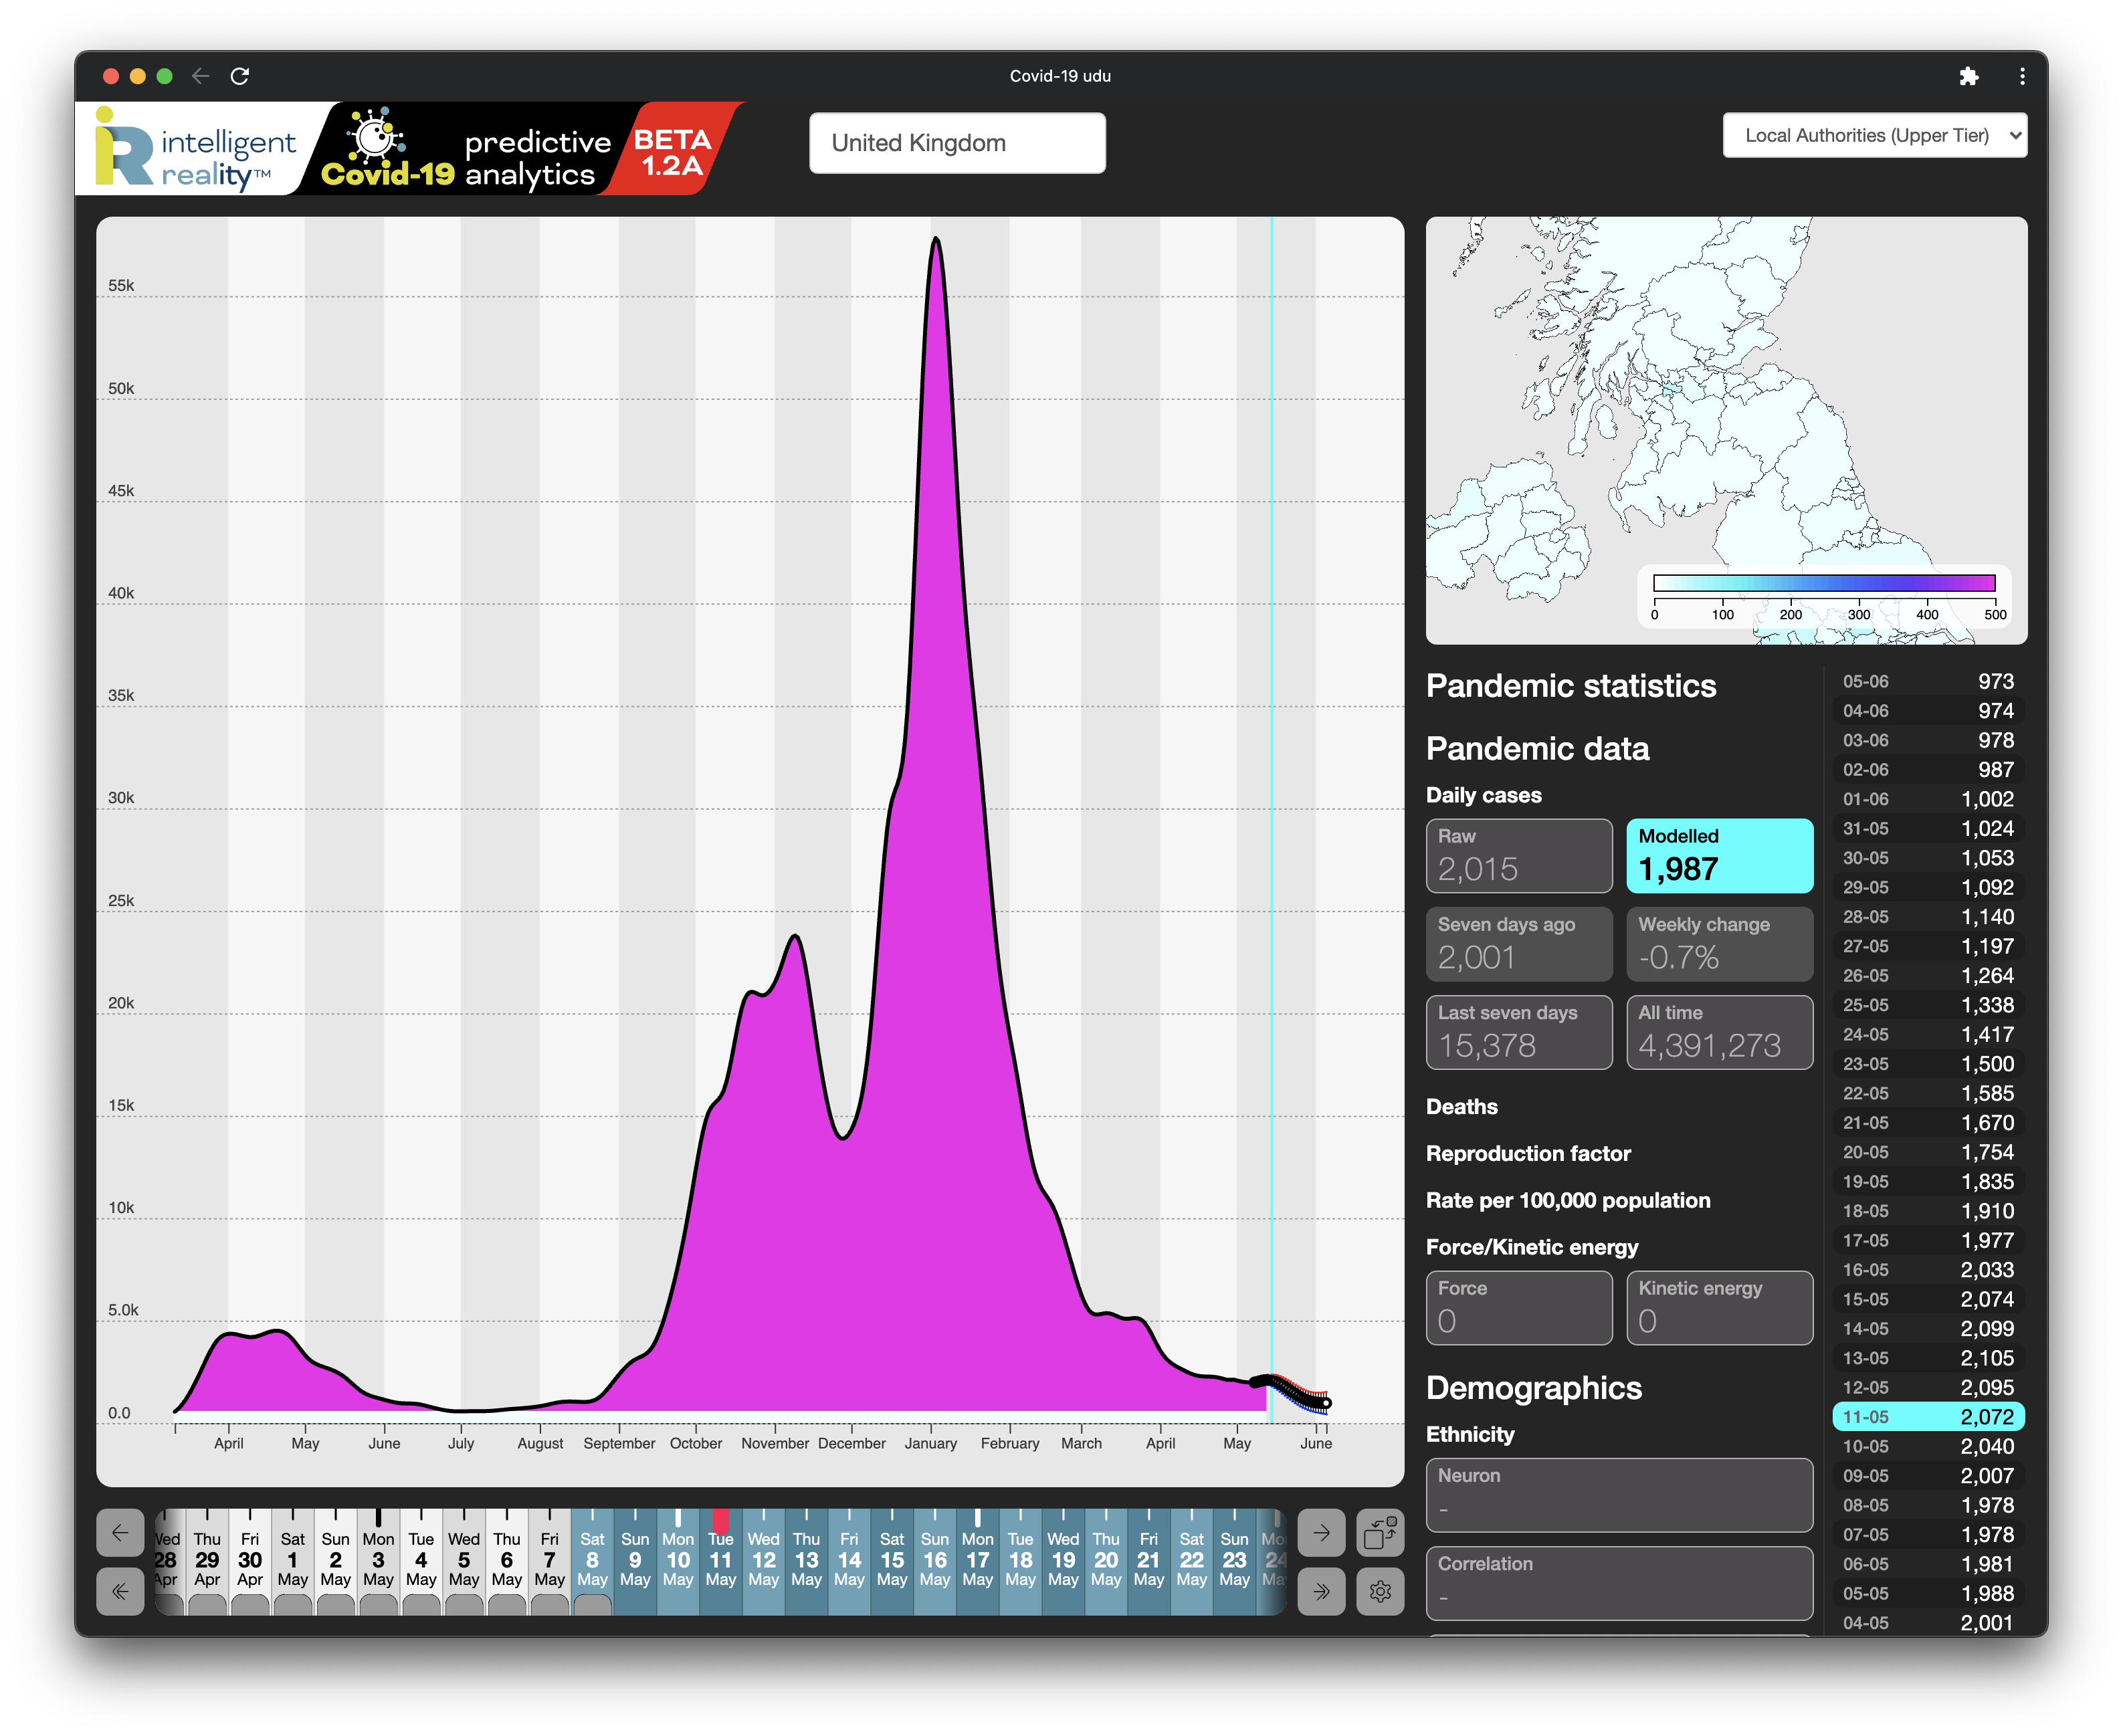
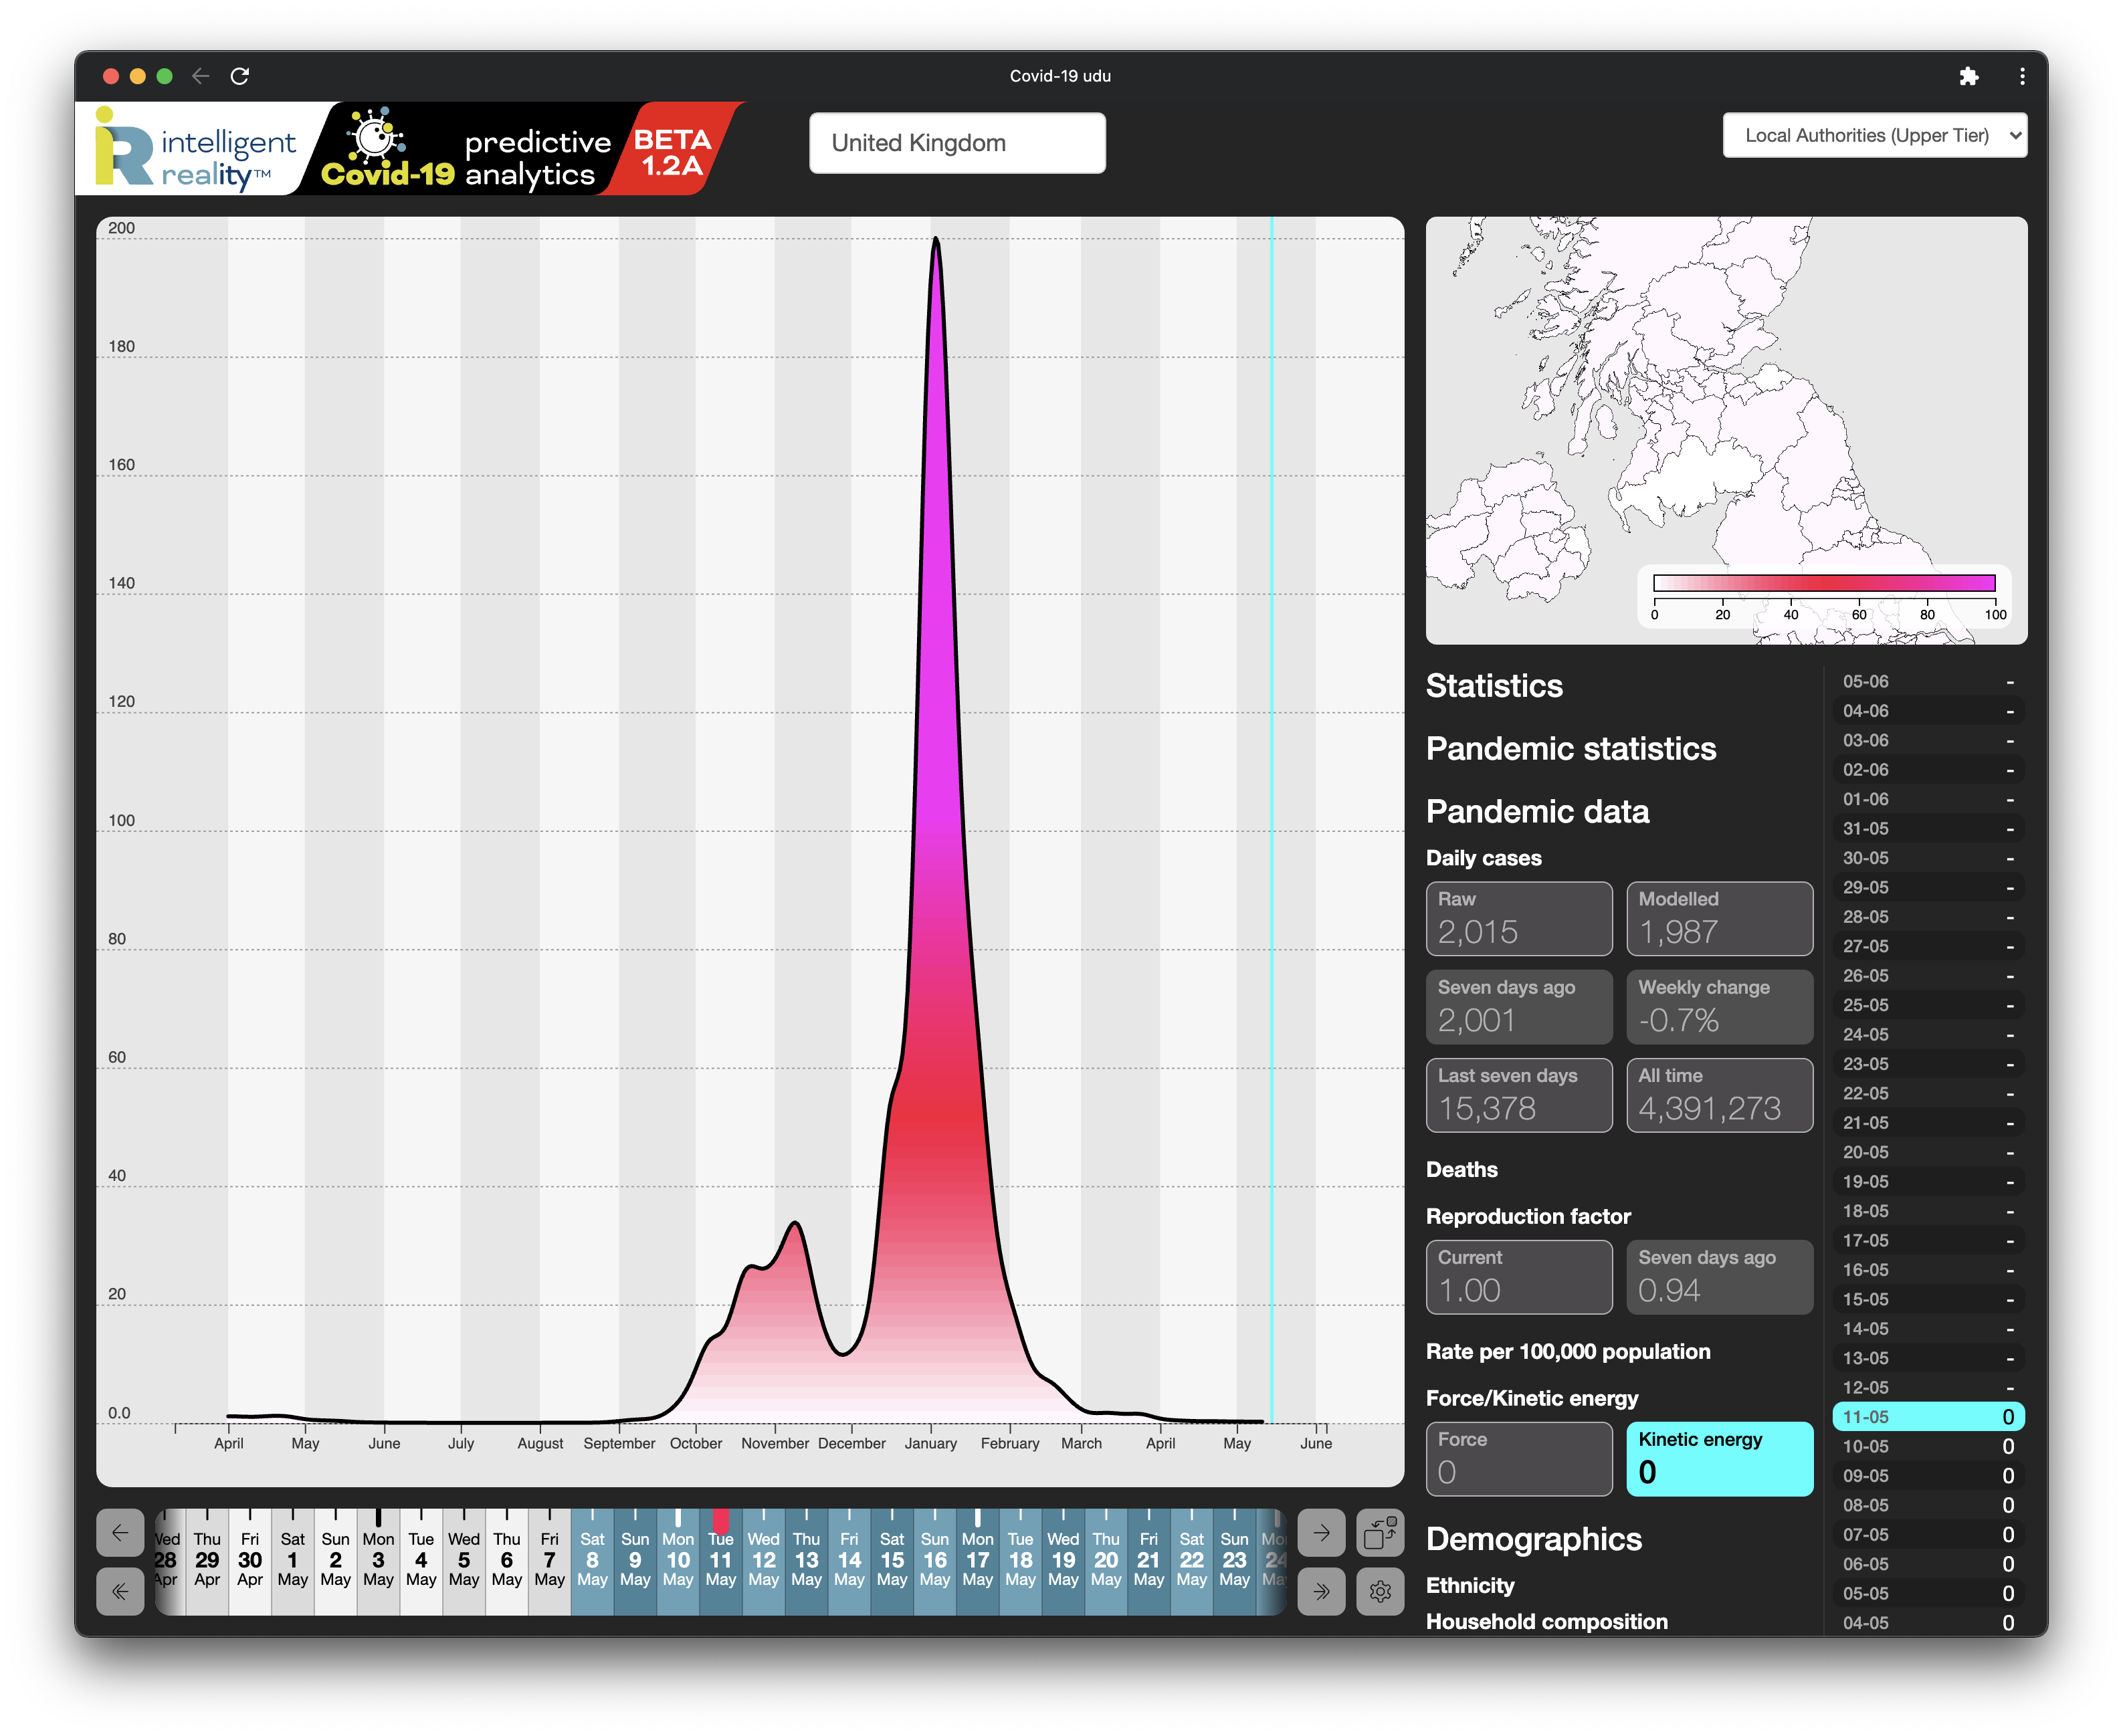
Turning then to the embodied ‘energy’ of the pandemic, we see that its overall momentum across the UK (Figure 7) is still very low, comparable to July/August 2020 and, again, the nationwide picture as of 11 May still looks healthy. But if we look at again at Bolton (Figure 8), we see a clear rise in the embodied energy of the pandemic.
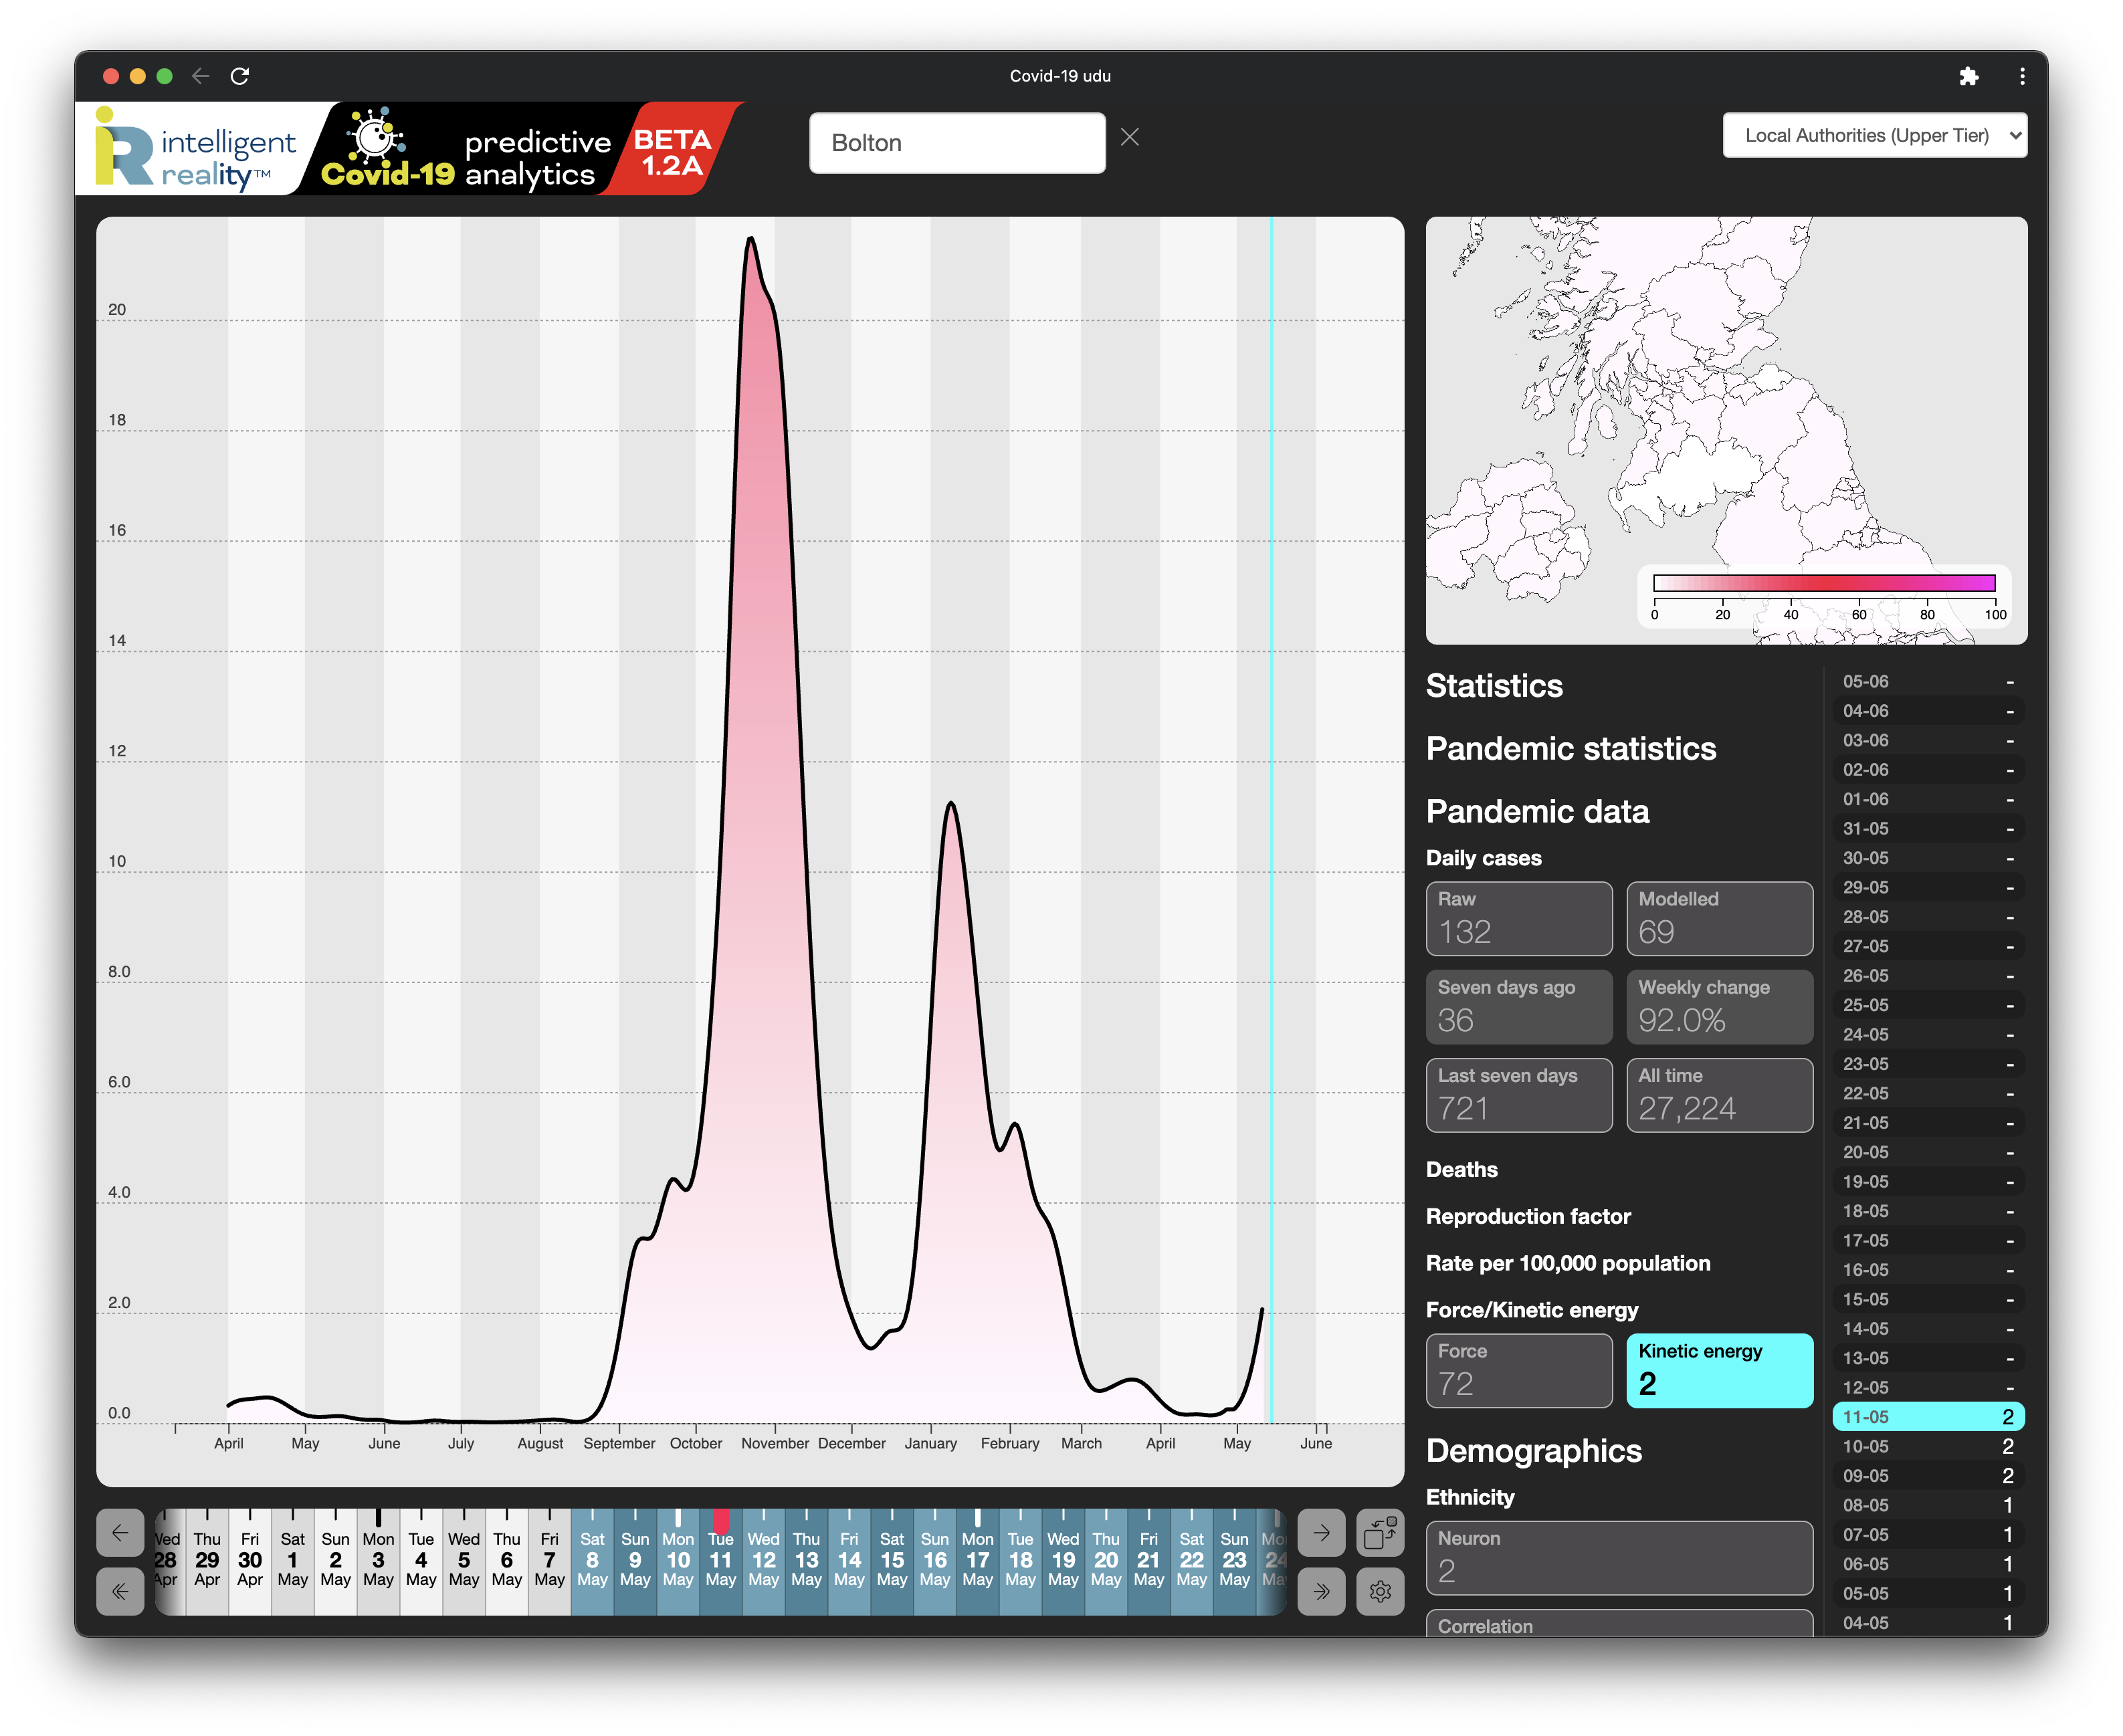
Taking acceleration and energy together, we clearly see the warning signs becoming very apparent during the last week of April.
Anyone using this approach would then have been able to take the early and pre-emptive action required then, rather than now, long after the horse has bolted.
Correlation and Inference
We don’t yet have the resources or the data to be able to drive a global model that includes variant spread and cross-border travel: we’d love to be able to do so.
However, we can already provide a high level of correlation to local factors. In this case, if we look at the pandemic force across South Yorkshire (Figure 9) and switch to the correlation between our AI’s clustering of similar local ethnicity and the national demographic (Figure 10), we see a strong correspondence between these areas of concern and ethnic representation from the Indian sub-continent (in fact, if you exclude Pakistan and Bangladeshi origins) the correlation with India stands out even more starkly).
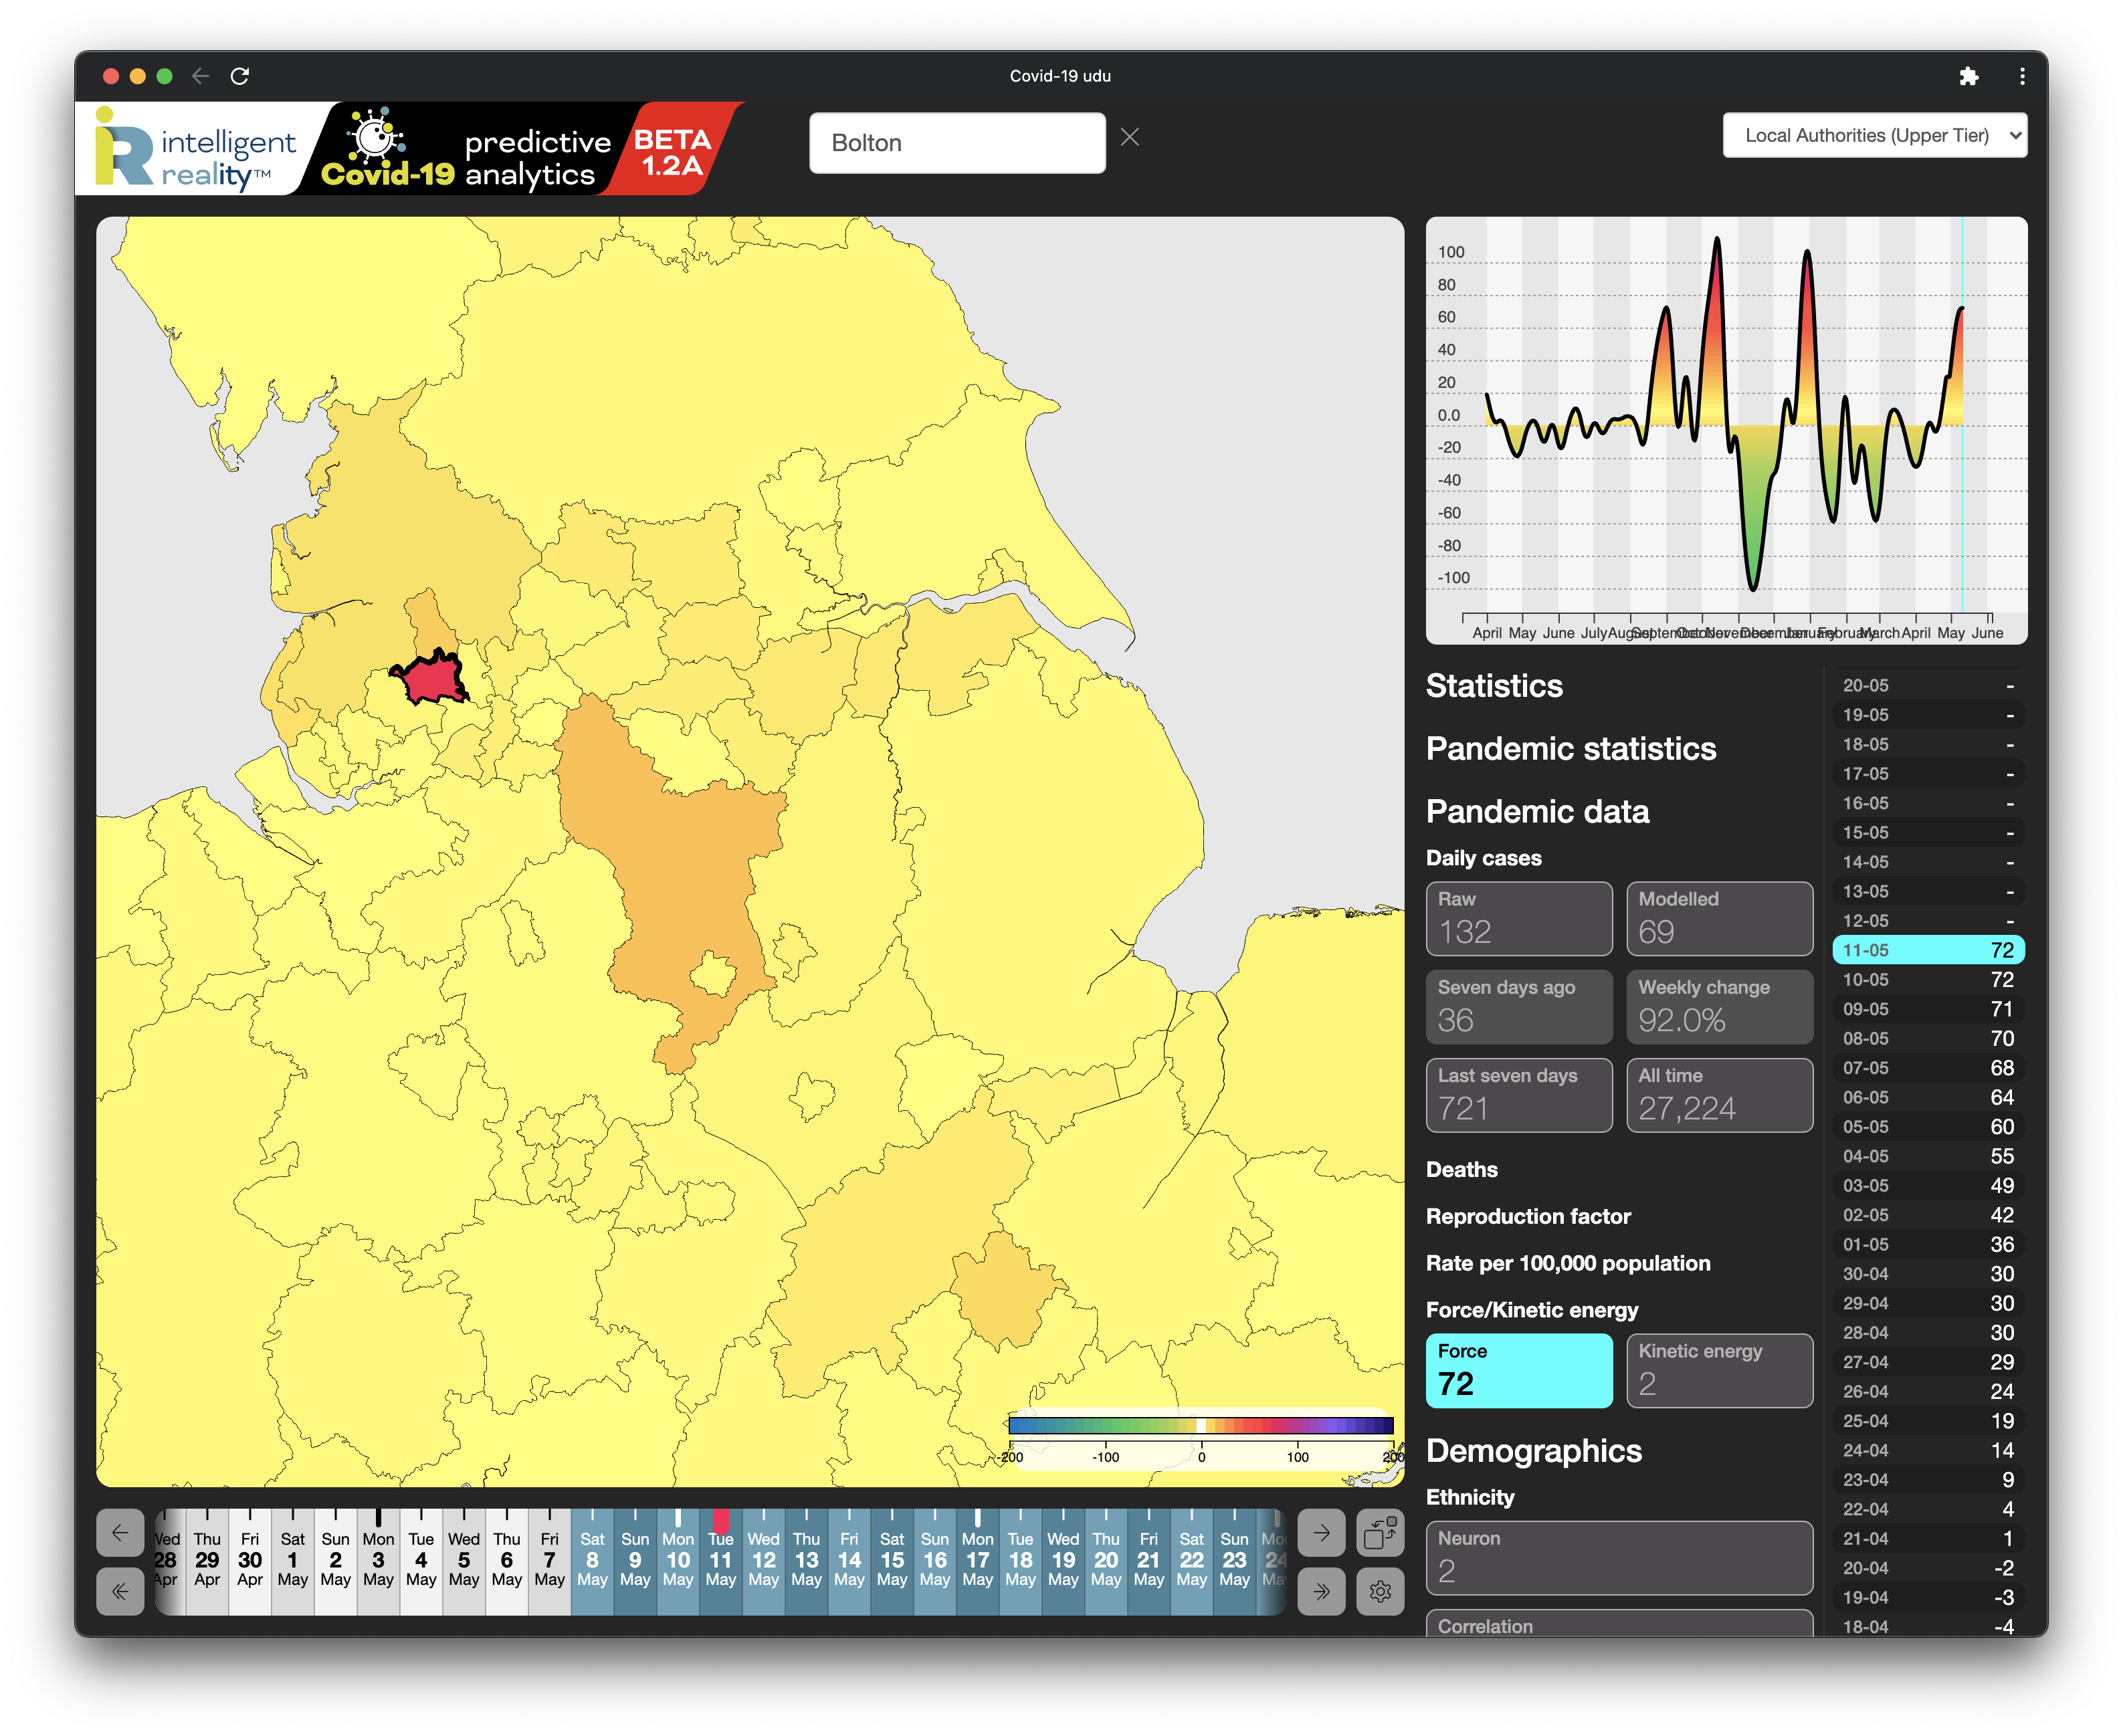
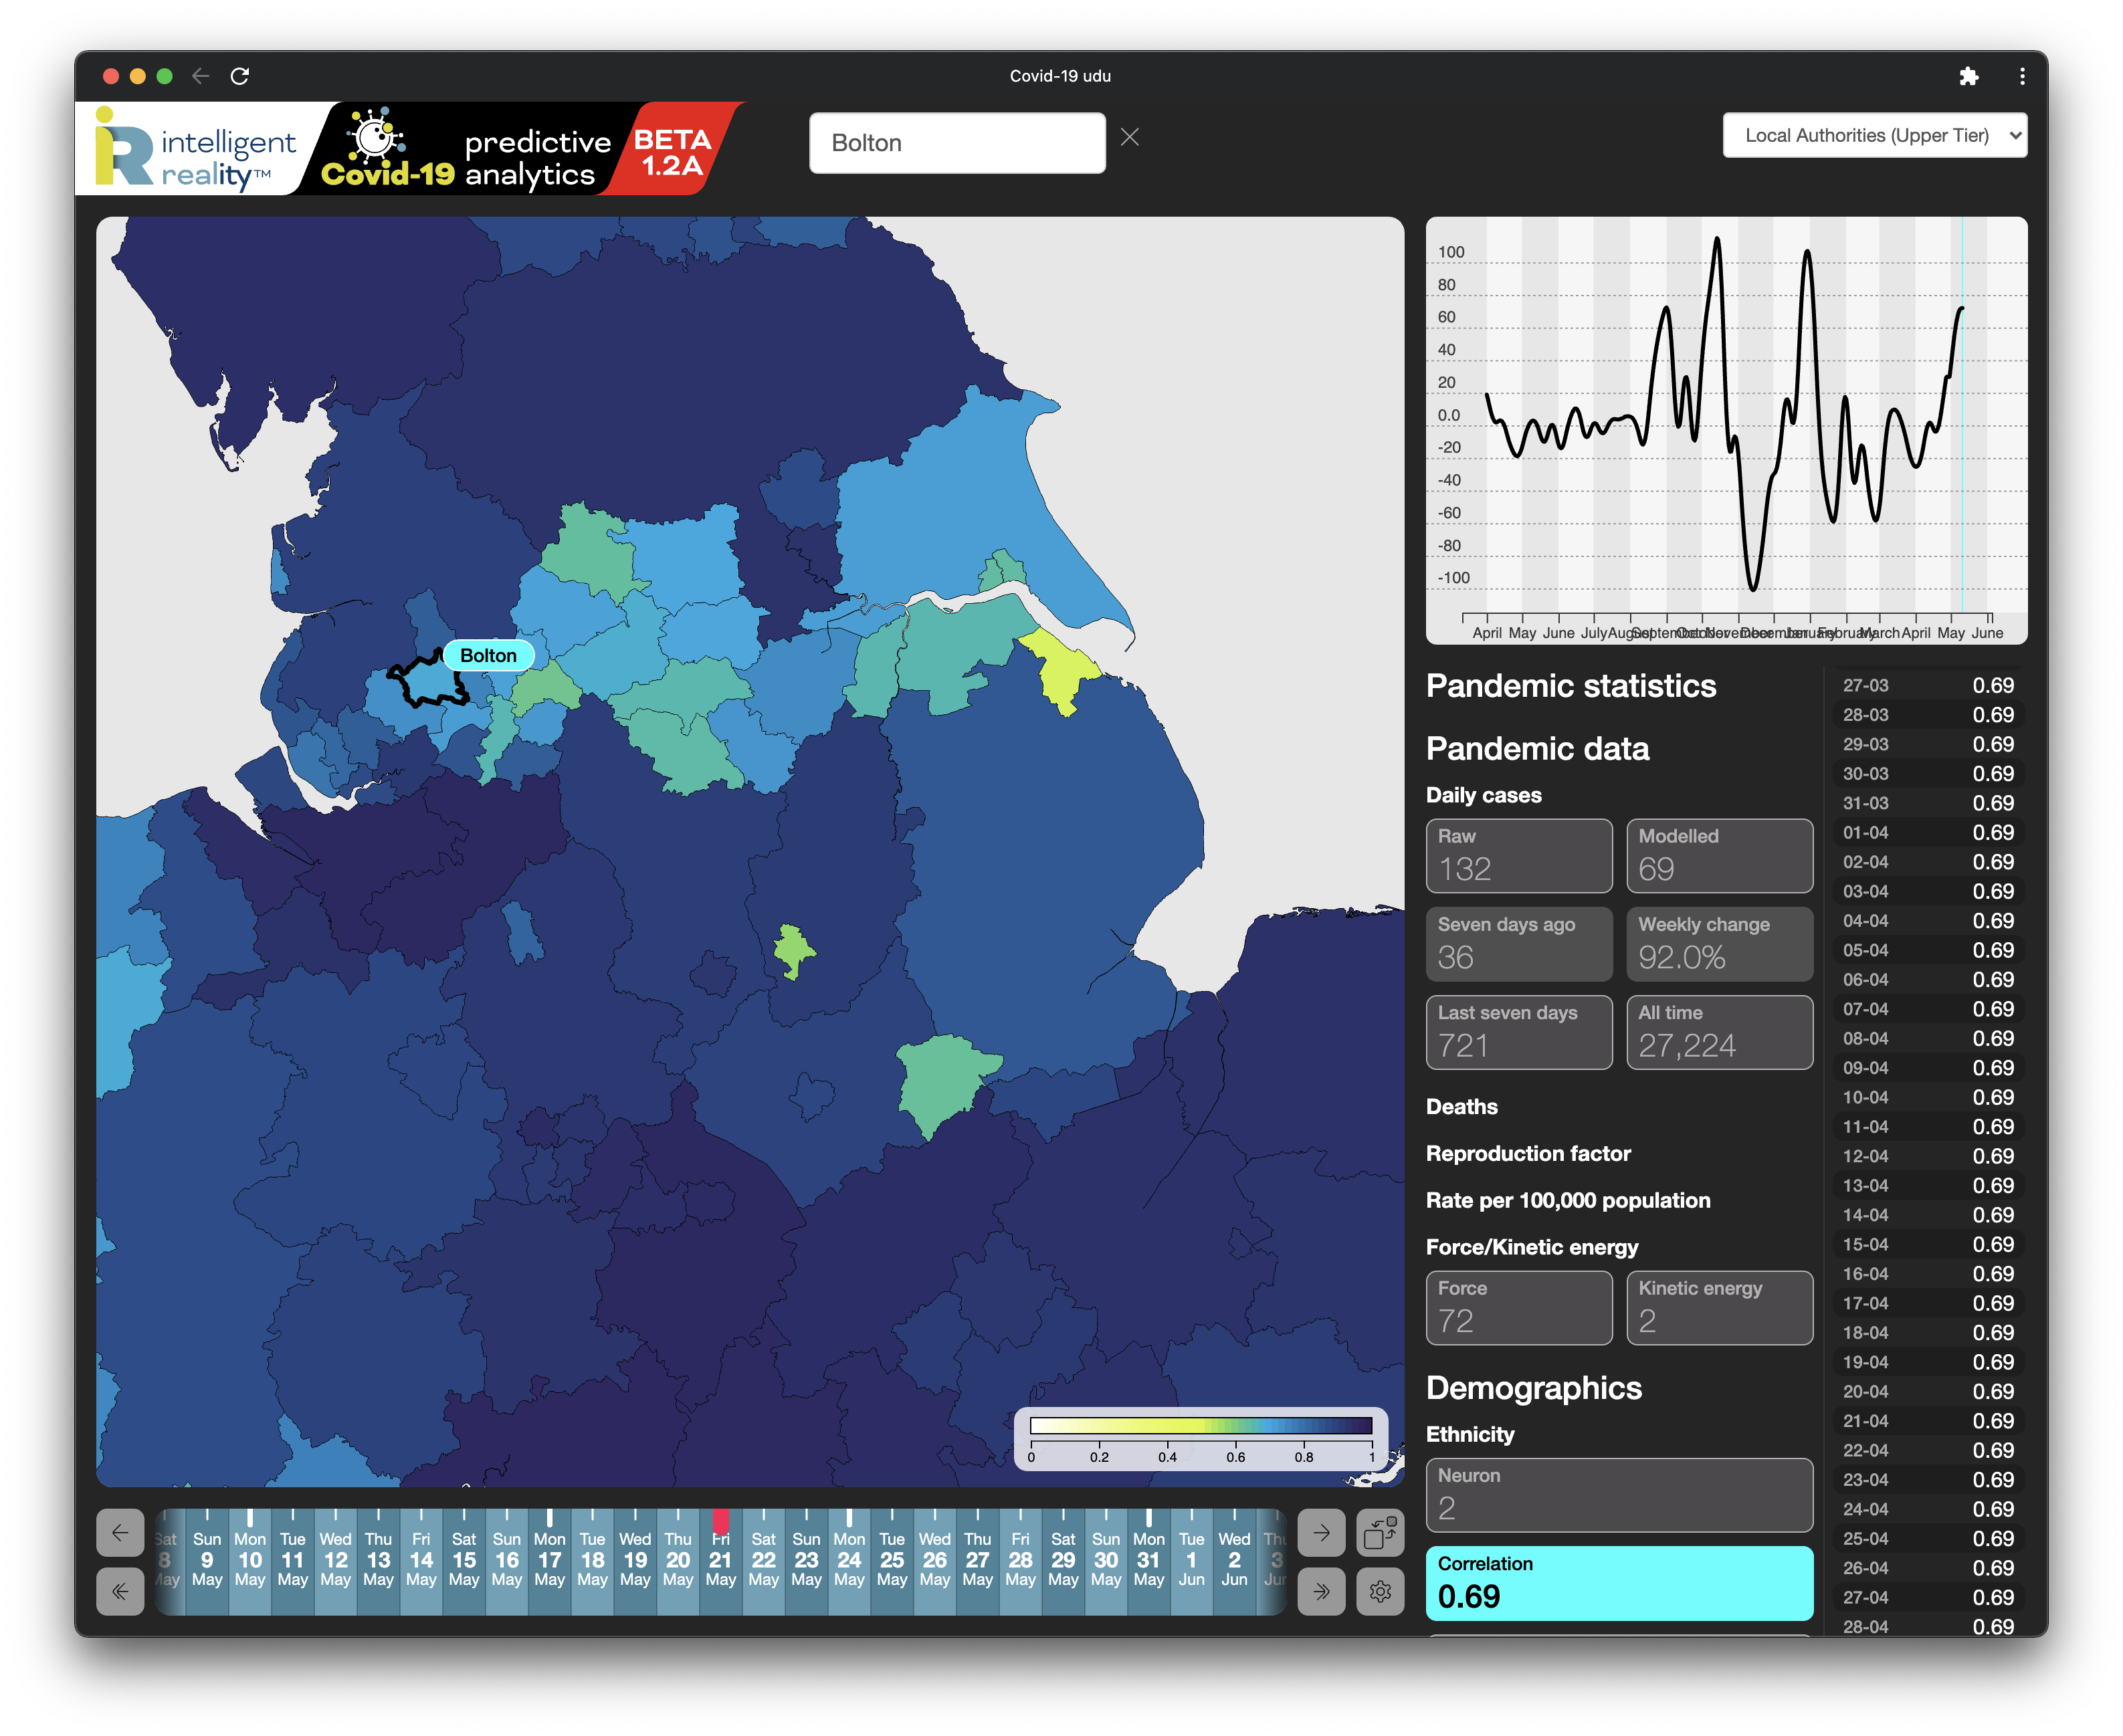
So, even in the absence of cross-border travel data, and even if we were ignorant of the situation in India (which is currently true of our system), we are still able to flag a direct correlation with the local ethnic demographic. Where a hot spot such as Bolton is emerging locally, rather than as part of a national trend, it also immediately raises alarm bells that incoming travellers related to the geographic origins of the local population are a potential factor.
So our analytics contained all the data needed to inform action that could have been taken at least a fortnight ago.
Approach
Our Covid-19 analytic platform uses emergent, data-driven techniques, rather than the hypothesis-based modelling and assumptive statistical techniques being used by most analytic tools.
We complement rather than replace Hypothesis-based models: these are exactly what you need when trying to determine causality of any phenomenon. Because they rely on a priori assumptions, to which you then apply a fixed range of data sources, they’re poor at primary analysis – surfacing the things you actually need to know about a dynamic situation but don’t actually know to look for in advance.
Which is where our approach comes into its own: we non-assumptively identify and create forecasts against relationships, patterns and trends in pandemic related data, and then correlate those with wider geospatial data, population demographics, tracked behaviour and anything else our system can discover about it.
We don’t try to address or assume causality, but our model can provide early identification of patterns and trends to inform decision making. which can then inform and stimulate causal investigation using hypothesis-driven models.
