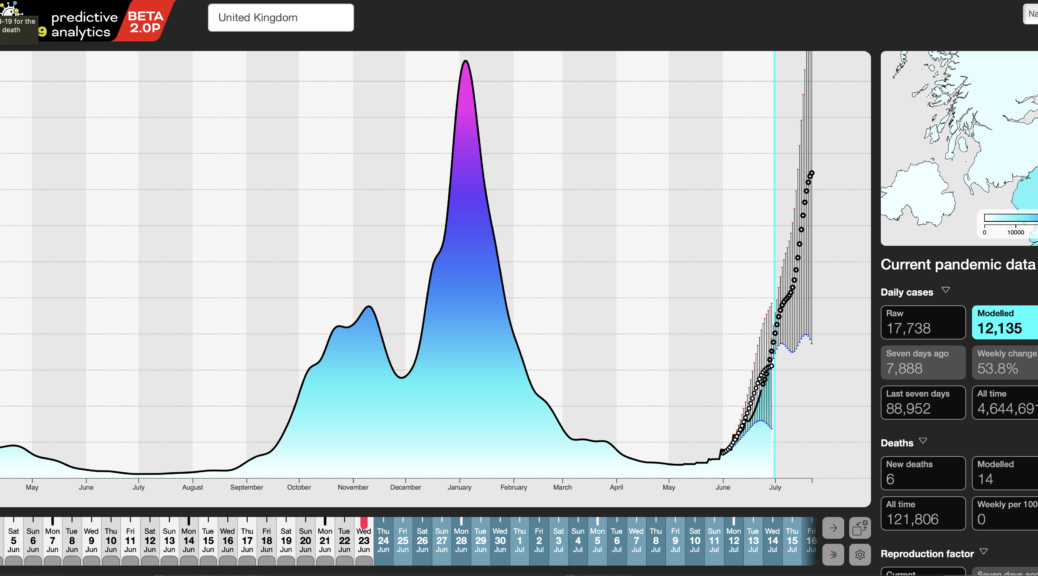
Taking the current rise in infections as an example, our analytic system has, consistently been able to forecast changes in the Covid-19 pandemic across the UK – we started with 14-day forecasts and have now pushed those out to 28 days. We made that change as we improved our algorithms, validated our earlier forecasts and, of course, as our system has had more historical data to work with, it’s got somewhat better at its job.
To validate the forecasts, we measure their daily predictions against what subsequently transpired – these can be displayed in our dashboard by clicking the grey tabs below each date in the horizontal date picker at the bottom.
For that period then, we have forty four 28-day hindcasts, plus the current forecast, from 24 June (today being the 30th – the lag is down to the rolling evolution of data quality for recent days).
For the UK, on thirty six of those forty four days, our forecasts generated a trajectory that closely matches the subsequently recorded change in case numbers, by which we mean effectively tracked the actual case numbers for at least two weeks into the 28-day forecast. We call those Actionable forecasts, in that they’ve proven accurate enough to confidently have taken policy decisions against.
Our header image shows the current forecast for the UK, overlaid with our hindcast for our forecast from 1 June. We think that speaks for itself.

